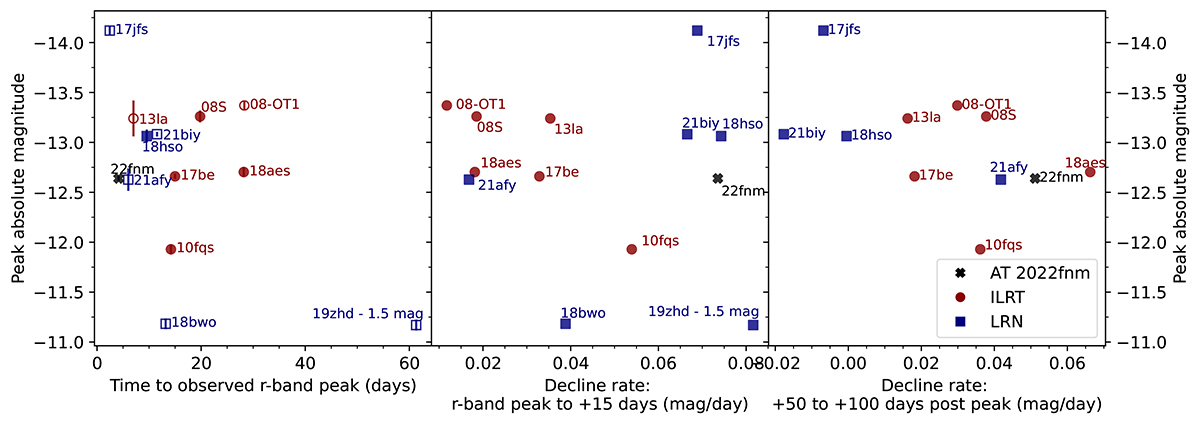
Fig. 5.
Download original image
Rise time and decline rates plotted against the (first) r-band peak for AT 2022fnm and comparison objects. Rise times plotted with filled markers are calculated against explosion or outburst epoch, whilst those with unfilled markers are calculated against the detection epoch. Rise times are calculated to the peak observed magnitude, which could be more sensitive to photometric uncertainties for objects whose light curve flattens around the peak.
Current usage metrics show cumulative count of Article Views (full-text article views including HTML views, PDF and ePub downloads, according to the available data) and Abstracts Views on Vision4Press platform.
Data correspond to usage on the plateform after 2015. The current usage metrics is available 48-96 hours after online publication and is updated daily on week days.
Initial download of the metrics may take a while.