Open Access
Fig. 10.
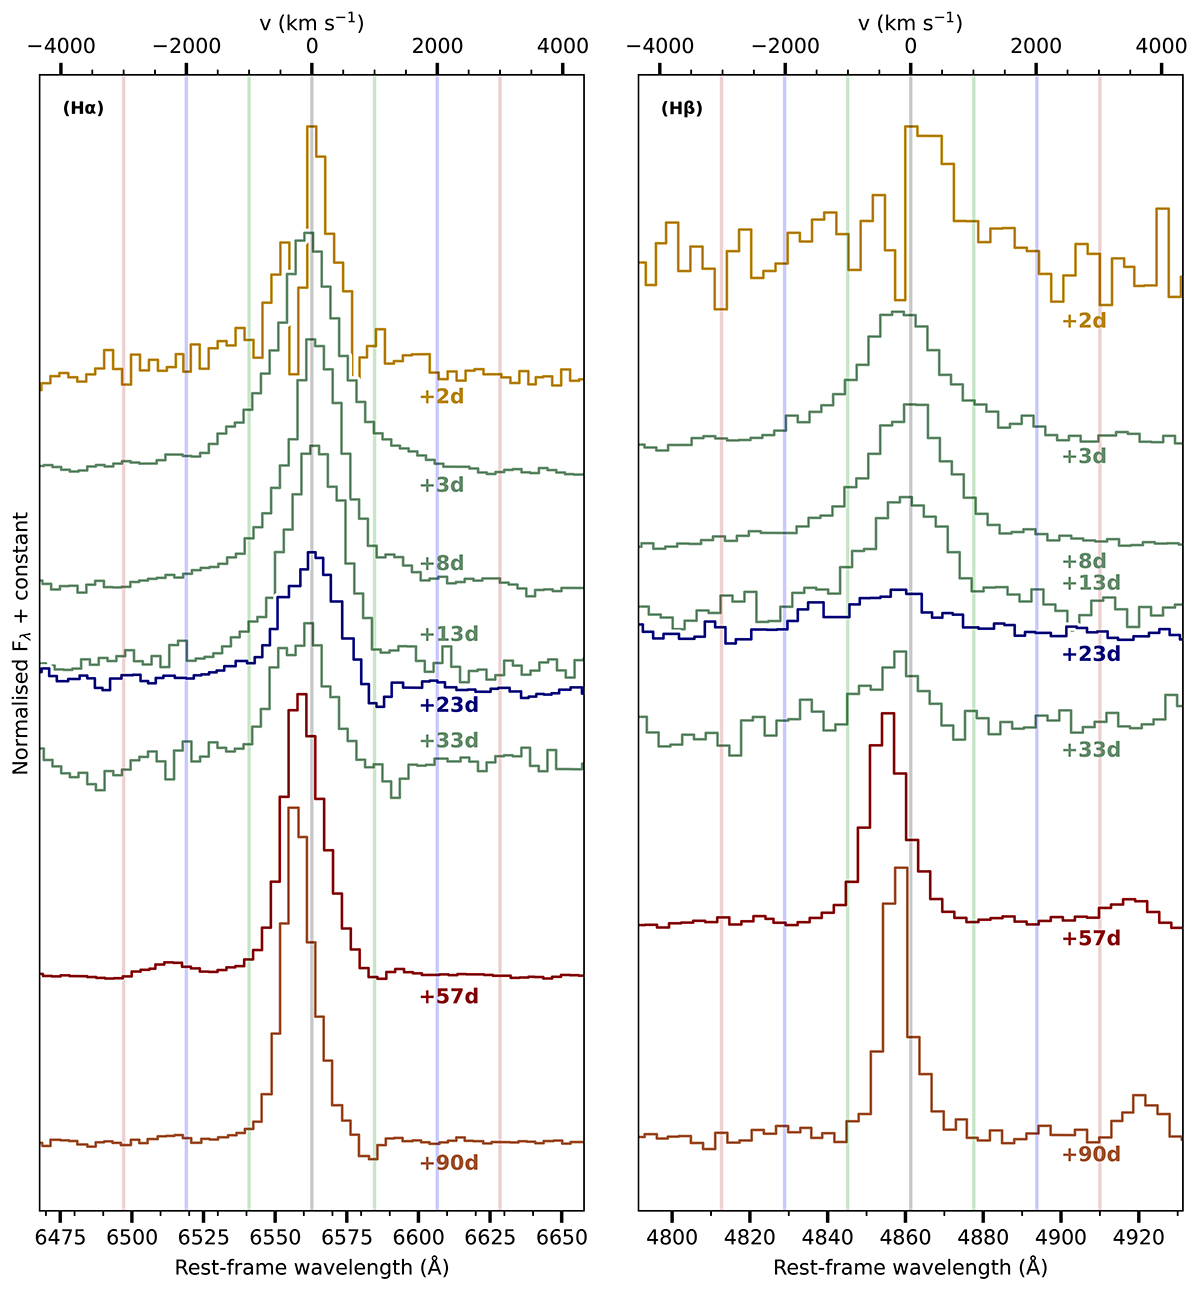
Download original image
Evolution of Hα and Hβ in AT 2022fnm over time. All spectra have been binned to a common pixel size and normalised against the peak of Hα in the left panel and Hβ in the right. Only spectra with both Hα and Hβ coverage are shown. Vertical lines marking ±1000, 2000, and 3000 km s−1 have been added to guide the eye.
Current usage metrics show cumulative count of Article Views (full-text article views including HTML views, PDF and ePub downloads, according to the available data) and Abstracts Views on Vision4Press platform.
Data correspond to usage on the plateform after 2015. The current usage metrics is available 48-96 hours after online publication and is updated daily on week days.
Initial download of the metrics may take a while.