Fig. 4
Download original image
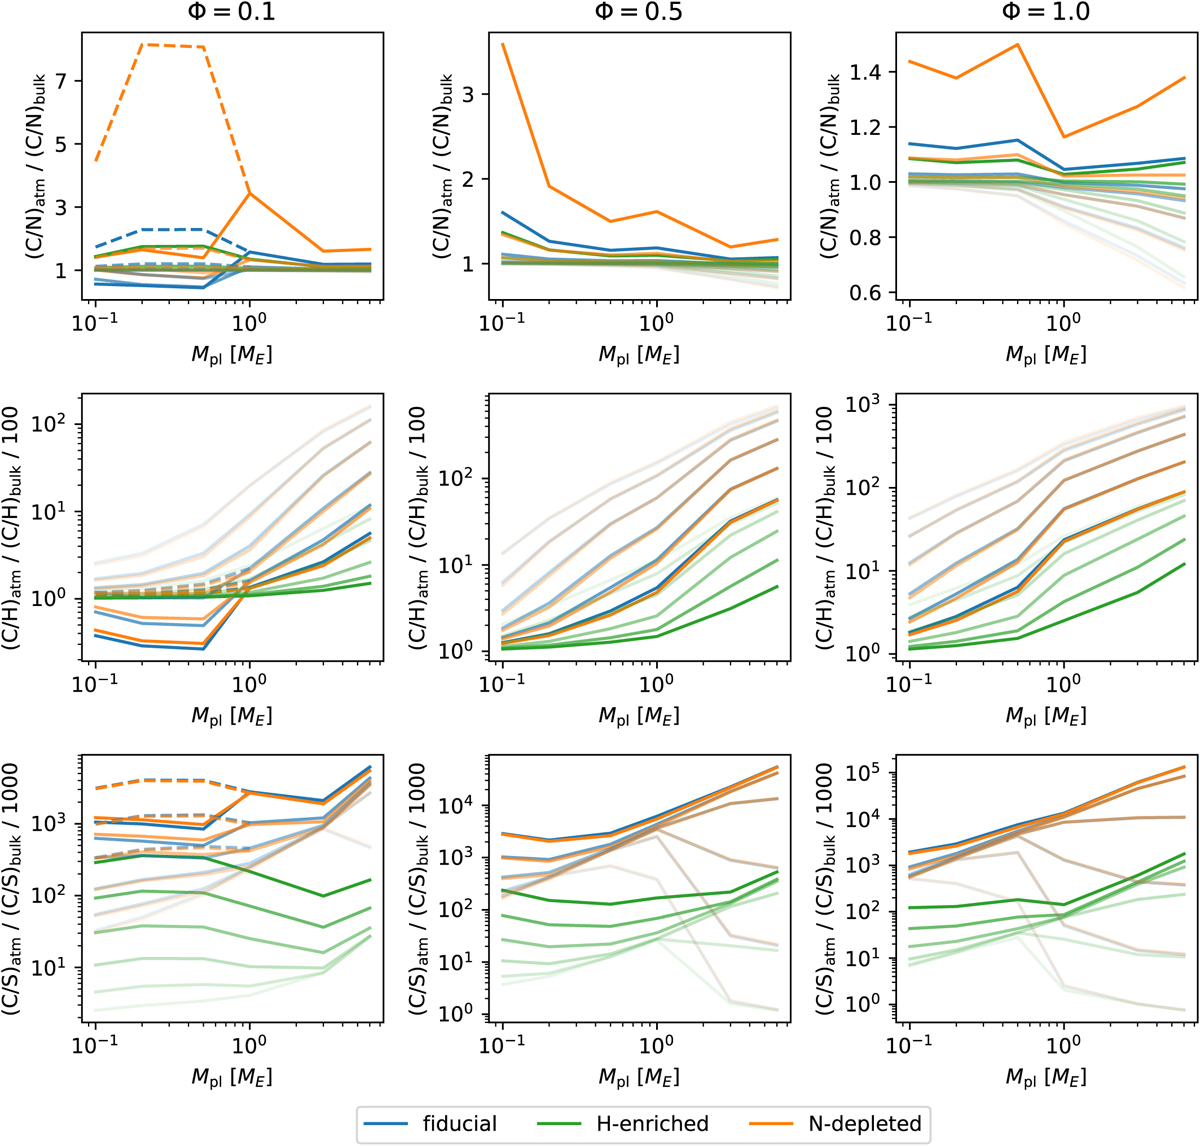
Atmospheric C/N (top row), C/H (middle row), and C/S (bottom row) normalized to the bulk value for all cases with Φ = 0.1 (left column), Φ = 0.5 (middle column), and Φ = 1 (right column). The blue, green, and orange lines correspond to the fiducial, H-rich, and N-depleted cases, respectively. The line shades correspond to the MO redox state (more transparent lines correspond to more oxidized cases, ranging from ΔIWeq = −5 to 0). The dashed lines (only in the left column) correspond to cases when graphite saturation was ignored. A bulk-similar atmosphere is plotted along y = 1, a C-enriched atmosphere (compared to N, H or S) above this line, and an or S-enriched atmosphere (compared to C) is plotted below. The y-axis is linear in the top row and logarithmic in the middle and bottom rows.
Current usage metrics show cumulative count of Article Views (full-text article views including HTML views, PDF and ePub downloads, according to the available data) and Abstracts Views on Vision4Press platform.
Data correspond to usage on the plateform after 2015. The current usage metrics is available 48-96 hours after online publication and is updated daily on week days.
Initial download of the metrics may take a while.