Fig. 1.
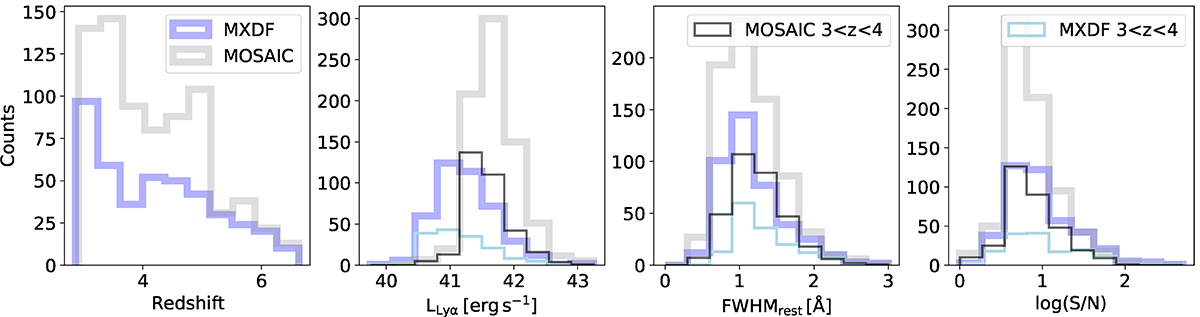
Download original image
Distribution of redshift (first panel), Lyα luminosity (second panel), Lyα line rest-frame FWHM (third panel), and S/N of Lyα line (fourth panel) of the LAE sample. The thick lines present the distributions of the whole galaxy samples in MXDF (blue lines) or MOSAIC (grey lines). The narrow lines show the LAEs at 3 < z < 4, the redshift range of most interest for this work.
Current usage metrics show cumulative count of Article Views (full-text article views including HTML views, PDF and ePub downloads, according to the available data) and Abstracts Views on Vision4Press platform.
Data correspond to usage on the plateform after 2015. The current usage metrics is available 48-96 hours after online publication and is updated daily on week days.
Initial download of the metrics may take a while.