Fig. 8
Download original image
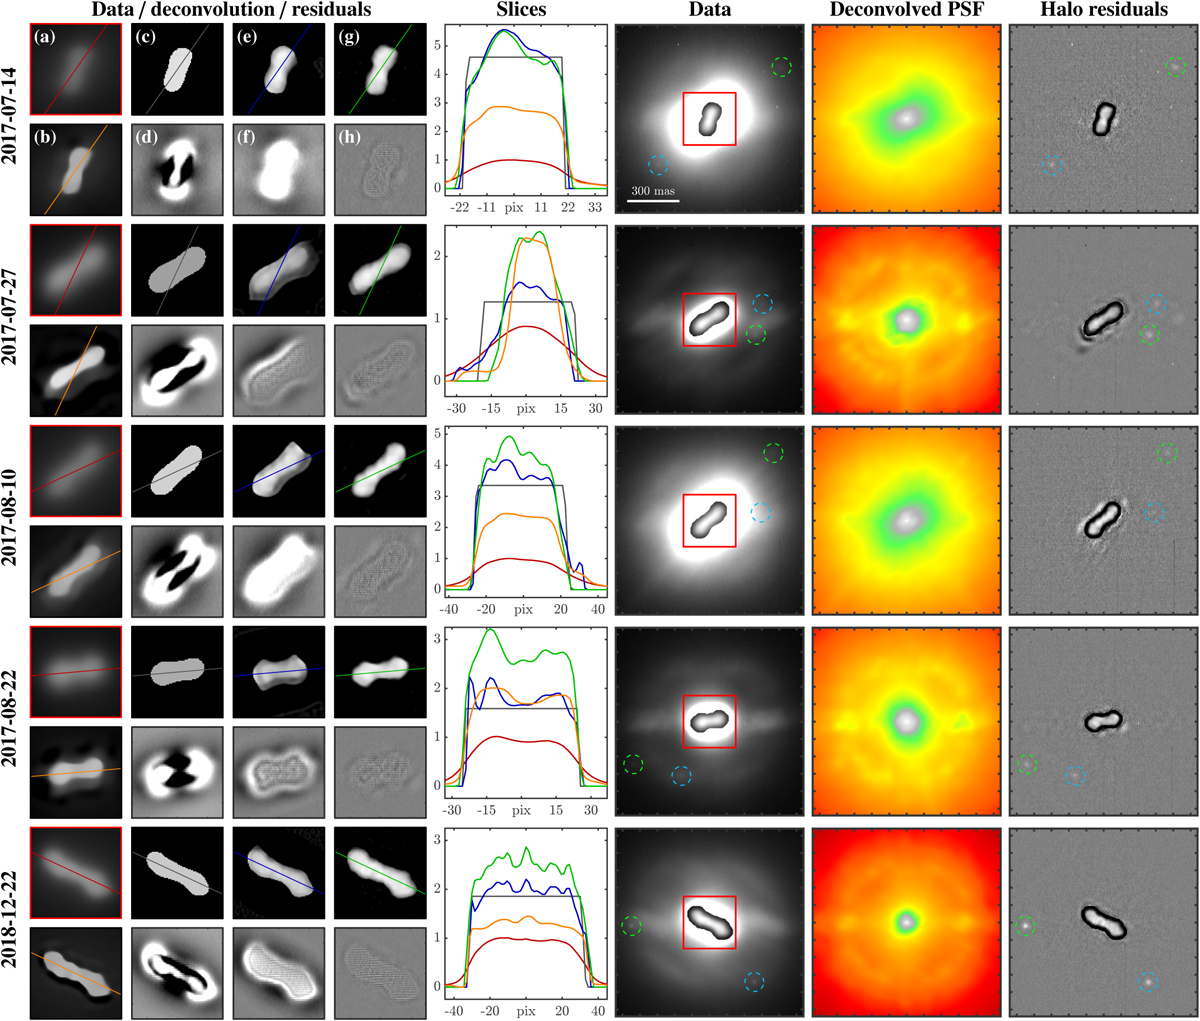
Examples of deconvolution on (216) Kleopatra at different epochs. First column – zoom on the main body. Panels a,b: data (top, red slice) and reference deconvolution (bottom, orange slice) obtained by Vernazza et al. (2021). Panels c,d: estimated binary object after the estimation of the PSF core parameters (top, grey slice) and residuals (bottom). Panels e,f: deconvolution with the PSF core (top, blue slice) and residuals (bottom). Panels g,h: deconvolution after the alternate estimation of the PSF wing (top, green slice) and residuals (bottom). To highlight the faint intensities, all the object representations share the same square root stretch intensity scale normalised to the data’s maximal value. The residuals are displayed with the colour scale of Fig. 2b. Second column - slices along the coloured lines of the first column. Third column - data displayed with the dual linear scale of Fig. 1a. Fourth column – PSF displayed with the colour scale of Fig. 1c (peak normalised to one). Fifth column – residuals of the halo model displayed with the colour scale of Fig. 1d. For information, the deconvolved main body image was inserted.
Current usage metrics show cumulative count of Article Views (full-text article views including HTML views, PDF and ePub downloads, according to the available data) and Abstracts Views on Vision4Press platform.
Data correspond to usage on the plateform after 2015. The current usage metrics is available 48-96 hours after online publication and is updated daily on week days.
Initial download of the metrics may take a while.