Open Access
Fig. 2
Download original image
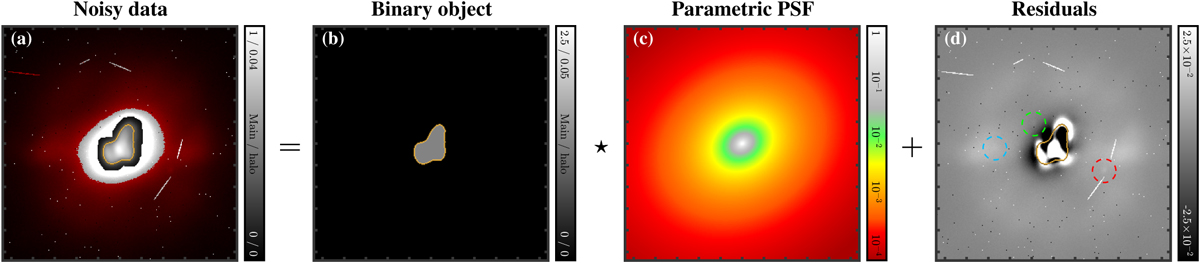
Step 1 – estimation of the PSF core. The data (Panel a, red-shaded pixels excluded from the fit) is approximated by the convolution of a binary object (Panel b, contour highlighted in orange) with a parametric PSF core (Panel c). Panel d: residuals. Colour bars: see Fig. 1.
Current usage metrics show cumulative count of Article Views (full-text article views including HTML views, PDF and ePub downloads, according to the available data) and Abstracts Views on Vision4Press platform.
Data correspond to usage on the plateform after 2015. The current usage metrics is available 48-96 hours after online publication and is updated daily on week days.
Initial download of the metrics may take a while.