Fig. B.1
Download original image
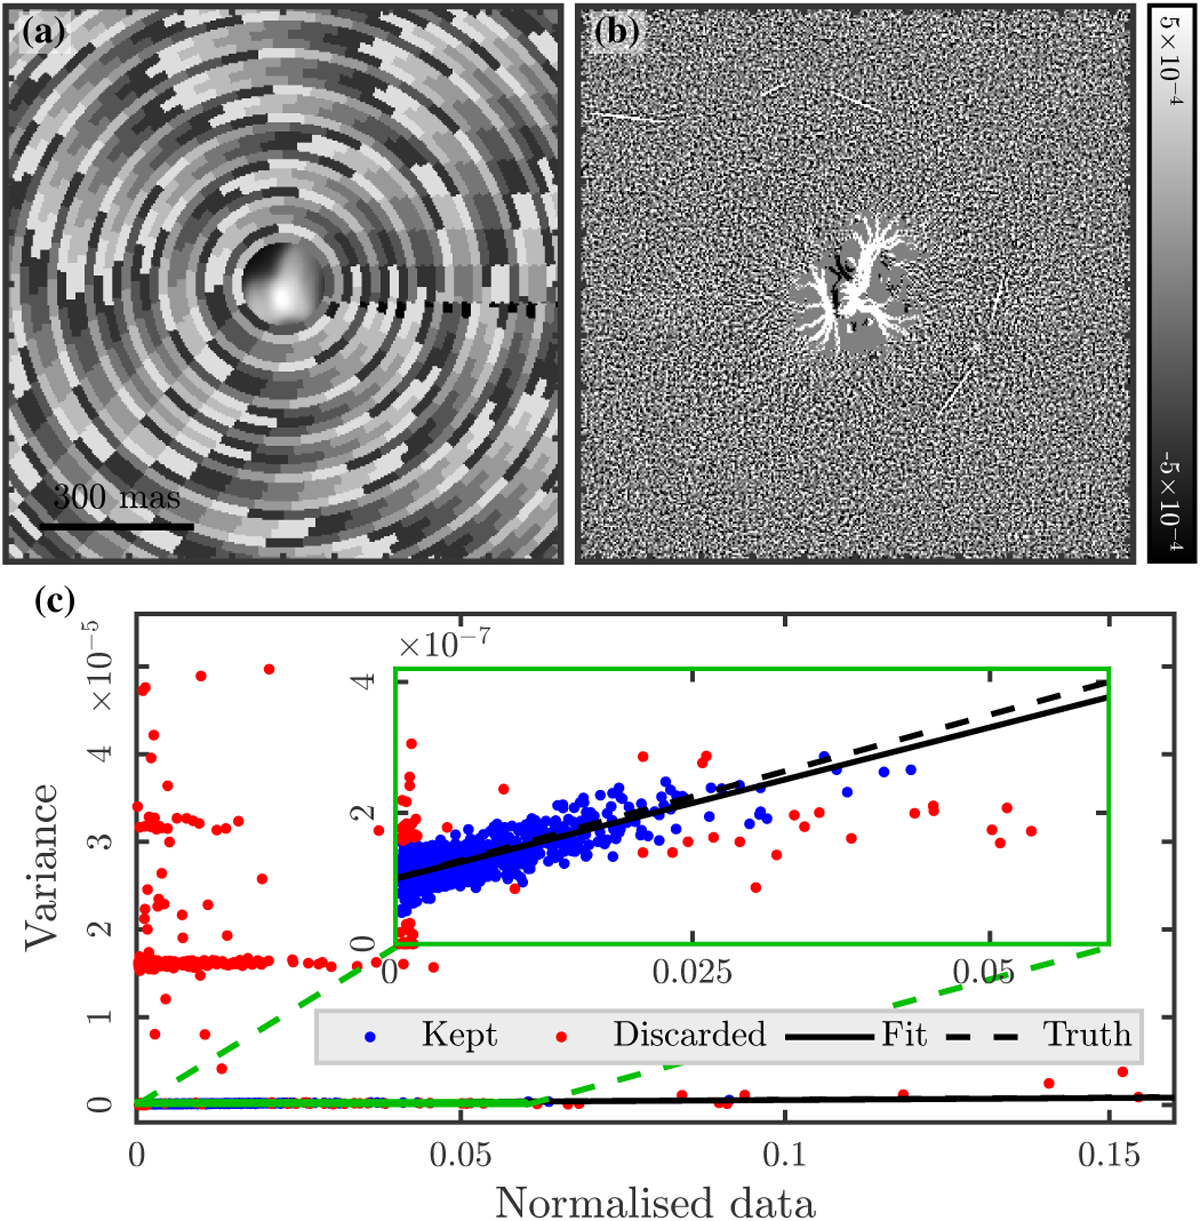
Empirical fit of the noise model, ηd(x) + υron, directly from the data. Panel a: Visualisation of the arcs centred on the main object on which the model is fitted. Panel b: Approximated map of the noise after removing a median filter on the data. Panel c: Estimated noise model (black curve) compared with the true model (dashed curve). In blue (resp. red): points that are kept (resp. discarded) by the robust fit. The green box is a zoom on the relevant points.
Current usage metrics show cumulative count of Article Views (full-text article views including HTML views, PDF and ePub downloads, according to the available data) and Abstracts Views on Vision4Press platform.
Data correspond to usage on the plateform after 2015. The current usage metrics is available 48-96 hours after online publication and is updated daily on week days.
Initial download of the metrics may take a while.