Fig. 8
Download original image
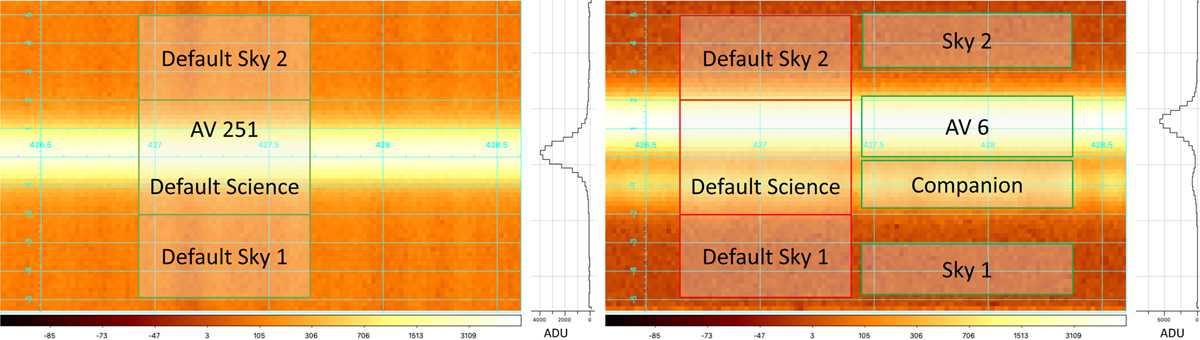
2D reduced spectrum of AV-251 (left) and AV-6 (right), revealing a faint companion 1″ below the spectrum of AV6. The overlaid grid indicates the wavelength axis (horizontal, in nm) and the spatial axis (vertical, in arcsec from the center of the slit). The default science and sky extraction windows and those adopted for AV-6 in this work are overlaid on the 2D spectrum. The color bar indicates the ADU level in the images (in log scale). The cross sections along the spatial direction are in units of ADU (in linear scale).
Current usage metrics show cumulative count of Article Views (full-text article views including HTML views, PDF and ePub downloads, according to the available data) and Abstracts Views on Vision4Press platform.
Data correspond to usage on the plateform after 2015. The current usage metrics is available 48-96 hours after online publication and is updated daily on week days.
Initial download of the metrics may take a while.