Fig. 5
Download original image
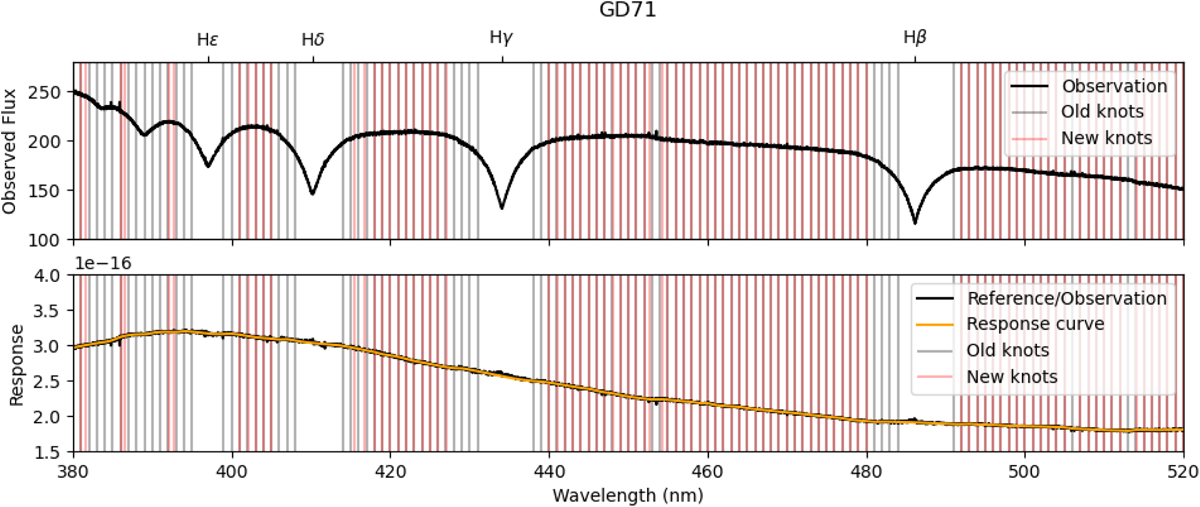
Comparison of knot points between the original knots (in gray) and the new knots (in red) used for interpolation in determining the response curve for GD 71 in the UVB arm. The top panel shows the observed spectra as a function of wavelength for one observation, while the bottom panel shows the reference model divided by the observation in black and the resulting response curve after interpolation in orange.
Current usage metrics show cumulative count of Article Views (full-text article views including HTML views, PDF and ePub downloads, according to the available data) and Abstracts Views on Vision4Press platform.
Data correspond to usage on the plateform after 2015. The current usage metrics is available 48-96 hours after online publication and is updated daily on week days.
Initial download of the metrics may take a while.