Open Access
Fig. 14
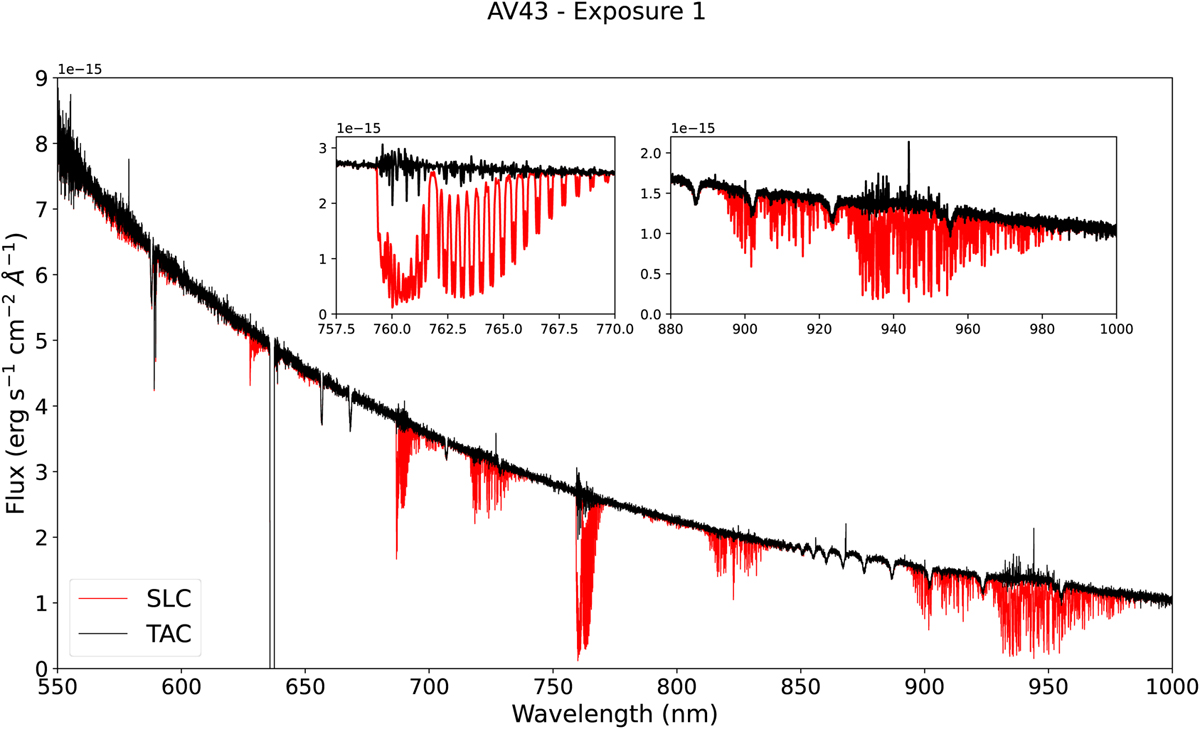
Download original image
Comparison of the spectrum of AV-43 before (SLC) and after (TAC) using the model from Fig. 13 to correct for telluric absorption. The insets show the two regions with the strongest absorption features; they are in the same units as the main panel.
Current usage metrics show cumulative count of Article Views (full-text article views including HTML views, PDF and ePub downloads, according to the available data) and Abstracts Views on Vision4Press platform.
Data correspond to usage on the plateform after 2015. The current usage metrics is available 48-96 hours after online publication and is updated daily on week days.
Initial download of the metrics may take a while.