Fig. 12
Download original image
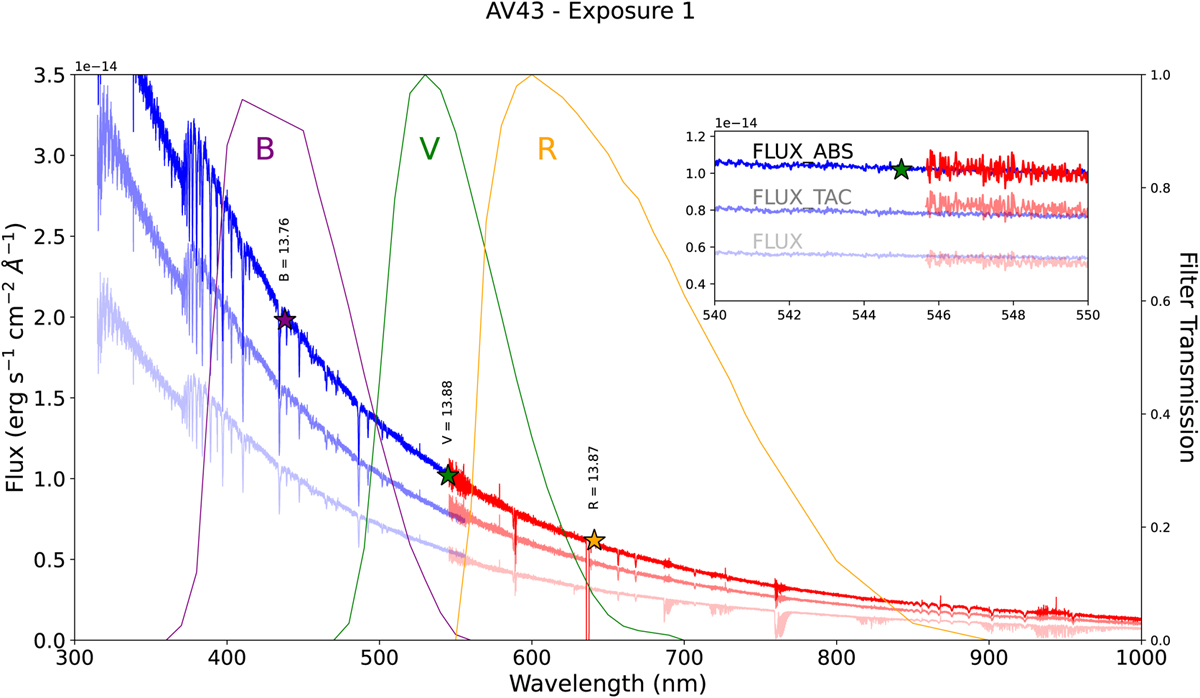
Comparison of the spectrum of AV-43 before slit-loss correction (lower spectrum), after slit-loss and telluric absorption correction (middle spectrum), and after the scaling to the B magnitude and lining up the VIS to the UVB (upper spectrum). The corresponding V and R magnitudes are indicated with star symbols. The transmission curves are from Bessell (1990).
Current usage metrics show cumulative count of Article Views (full-text article views including HTML views, PDF and ePub downloads, according to the available data) and Abstracts Views on Vision4Press platform.
Data correspond to usage on the plateform after 2015. The current usage metrics is available 48-96 hours after online publication and is updated daily on week days.
Initial download of the metrics may take a while.