Fig. 11
Download original image
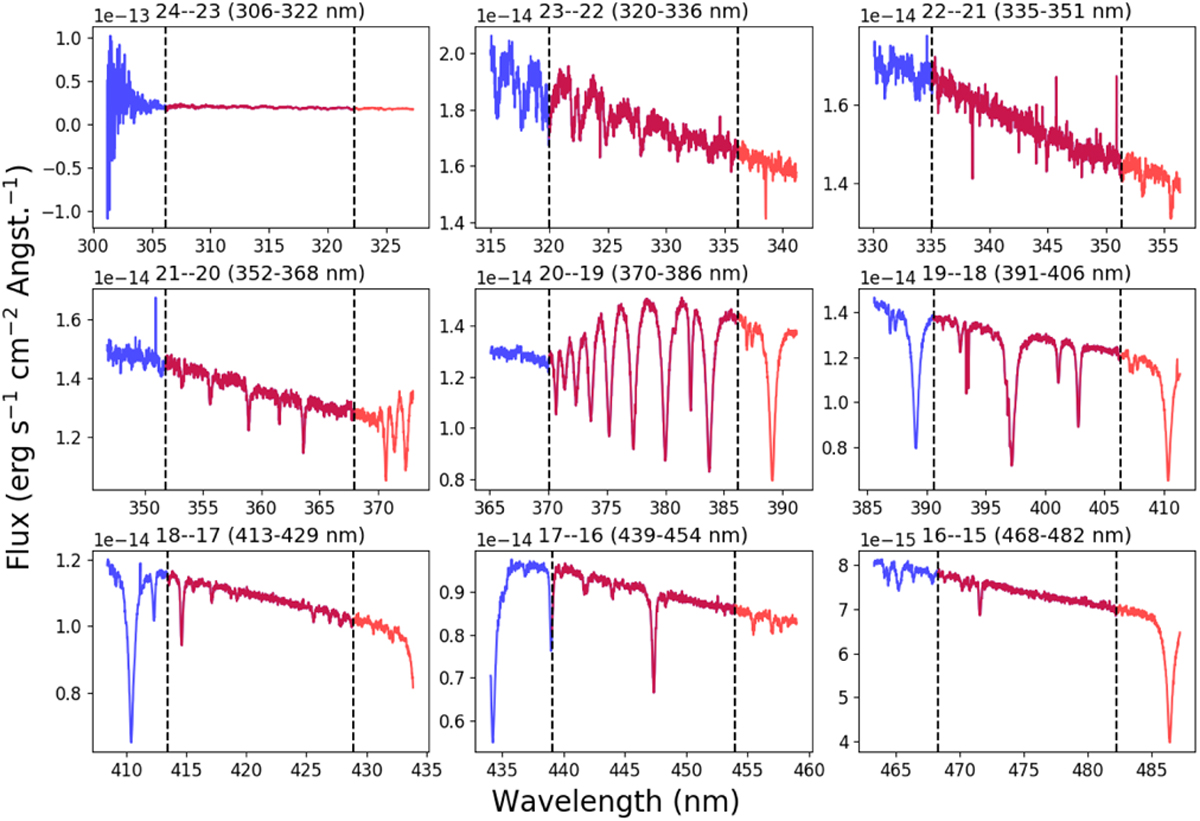
Examples from the reduced UVB spectrum of 2DFS-3694 illustrating the absence of order re-connection artifacts. The blue and orange lines correspond to the wavelength regions of the first and second orders (as presented at each panel). The vertical dashed lines indicate the locations of the order re-connections (highlighted as red lines, which is the overlapping of the blue and orange regions). The order numbers and the common wavelength range of the orders are indicated at the top of each panel.
Current usage metrics show cumulative count of Article Views (full-text article views including HTML views, PDF and ePub downloads, according to the available data) and Abstracts Views on Vision4Press platform.
Data correspond to usage on the plateform after 2015. The current usage metrics is available 48-96 hours after online publication and is updated daily on week days.
Initial download of the metrics may take a while.