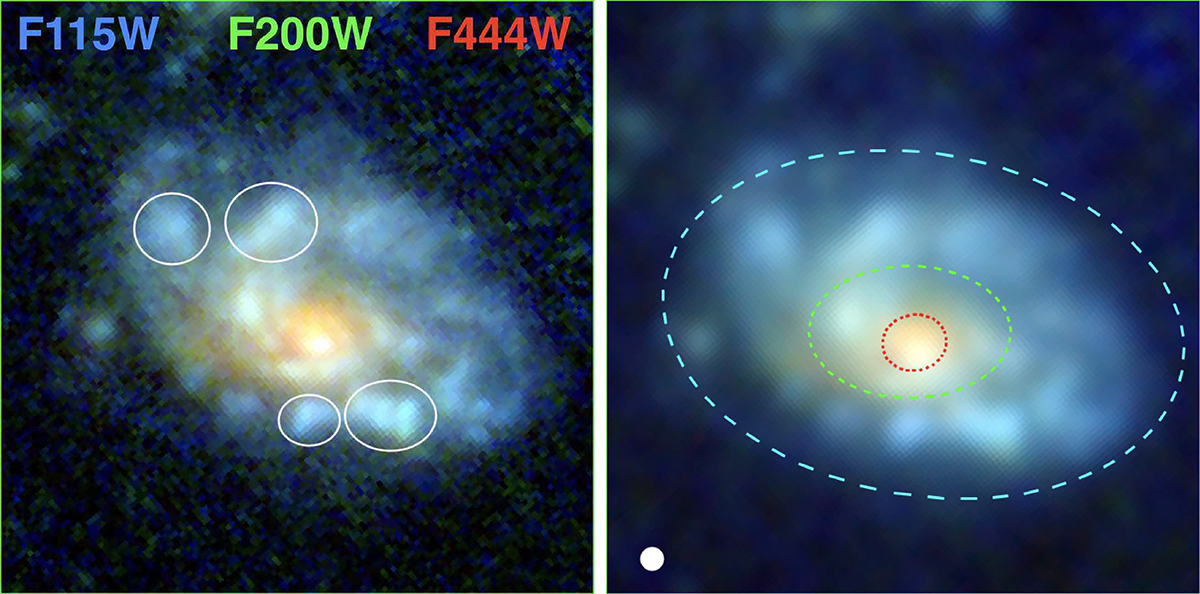
Fig. 7.
Download original image
RGB (F115W, F200W, F444W) image of the galaxy ID15371 (3.6″ × 3.6″) at zspec = 1.921 before (left panel) and after (right panel) PSF matching. In the left panel, the white ellipses show the features we identified and counted as clumps. In the right panel, the colored dotted lines correspond to the division of the galaxy in homogeneously colored regions that we studied separately and the white filled circle shows the PSF size.
Current usage metrics show cumulative count of Article Views (full-text article views including HTML views, PDF and ePub downloads, according to the available data) and Abstracts Views on Vision4Press platform.
Data correspond to usage on the plateform after 2015. The current usage metrics is available 48-96 hours after online publication and is updated daily on week days.
Initial download of the metrics may take a while.