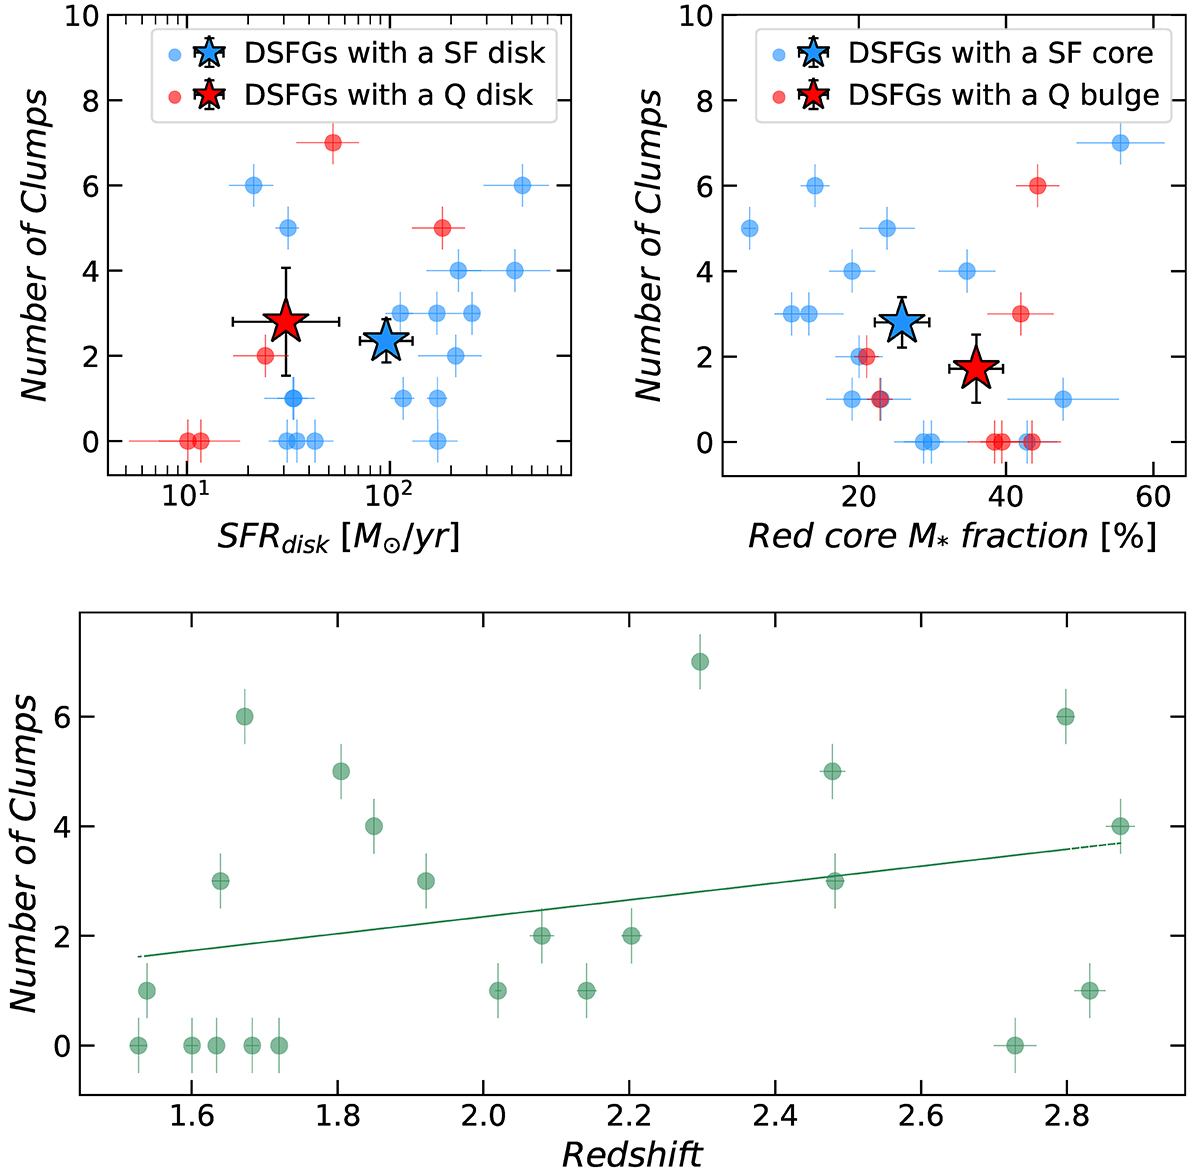
Fig. 22.
Download original image
Distribution of the number of clumps in the disk versus its SFR (upper-left panel), the core stellar mass fraction (upper-right panel), and the redshift (lower panel). In the upper panels, galaxies are divided in two groups depending on the star-forming activity of their disk or of their core (left and right panel respectively). Circular markers are individual galaxies, star markers are the mean value for different groups of galaxies with their associated error bar indicating the error of the mean. In the lower panel, the line is a linear regression of the distribution showing an increase of the average number of clumps with redshift
Current usage metrics show cumulative count of Article Views (full-text article views including HTML views, PDF and ePub downloads, according to the available data) and Abstracts Views on Vision4Press platform.
Data correspond to usage on the plateform after 2015. The current usage metrics is available 48-96 hours after online publication and is updated daily on week days.
Initial download of the metrics may take a while.