Fig. 2.
Download original image
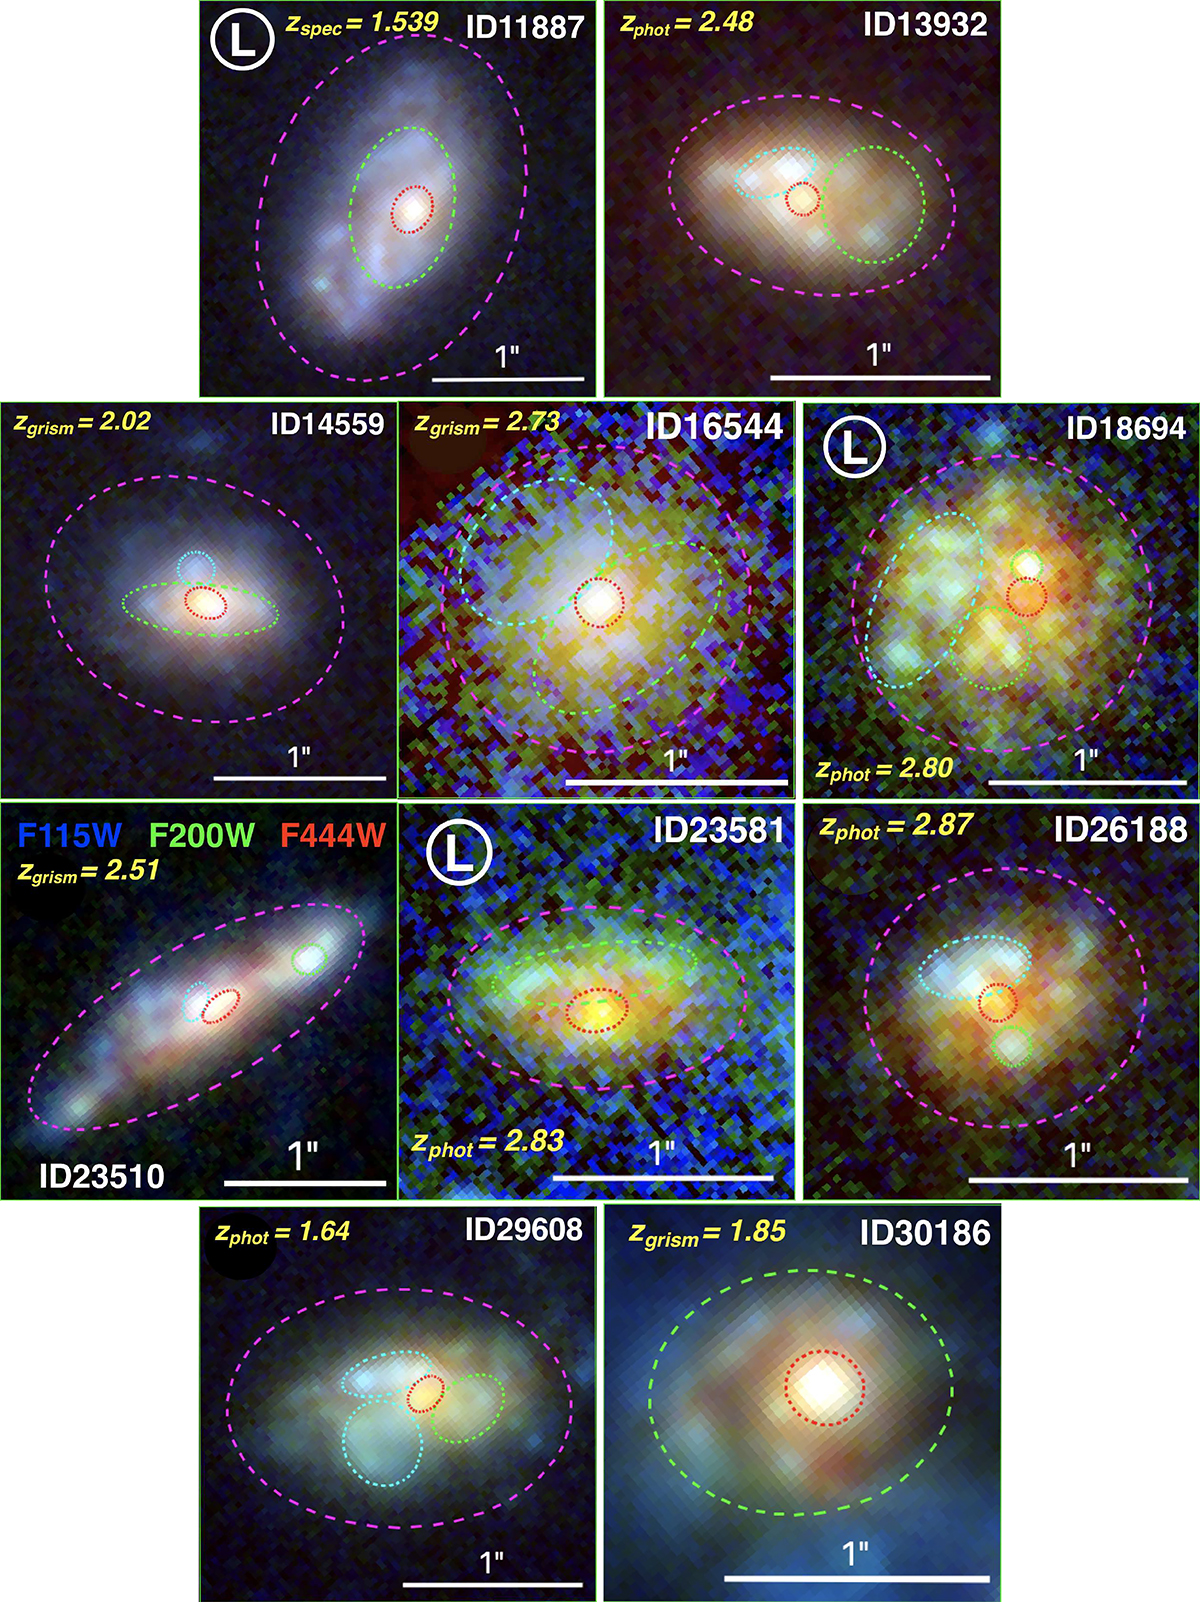
Type I: star-forming disks with a red star-forming core (see Sect. 3.7). RGB (F115W, F200W, F444W) non-PSF-matched cutouts. In each cutout, the white bar defines the scale of the image. The dotted regions correspond to the different studied components, the core and bulges are shown in red, while the disks are shown in green, blue or magenta and divided in several components showing color patches when present, see Sect. 3.5. The galaxies with a “&#Xtextcircled;L” are the most lopsided galaxies of our sample (see Sect. 4.1.3).
Current usage metrics show cumulative count of Article Views (full-text article views including HTML views, PDF and ePub downloads, according to the available data) and Abstracts Views on Vision4Press platform.
Data correspond to usage on the plateform after 2015. The current usage metrics is available 48-96 hours after online publication and is updated daily on week days.
Initial download of the metrics may take a while.