Open Access
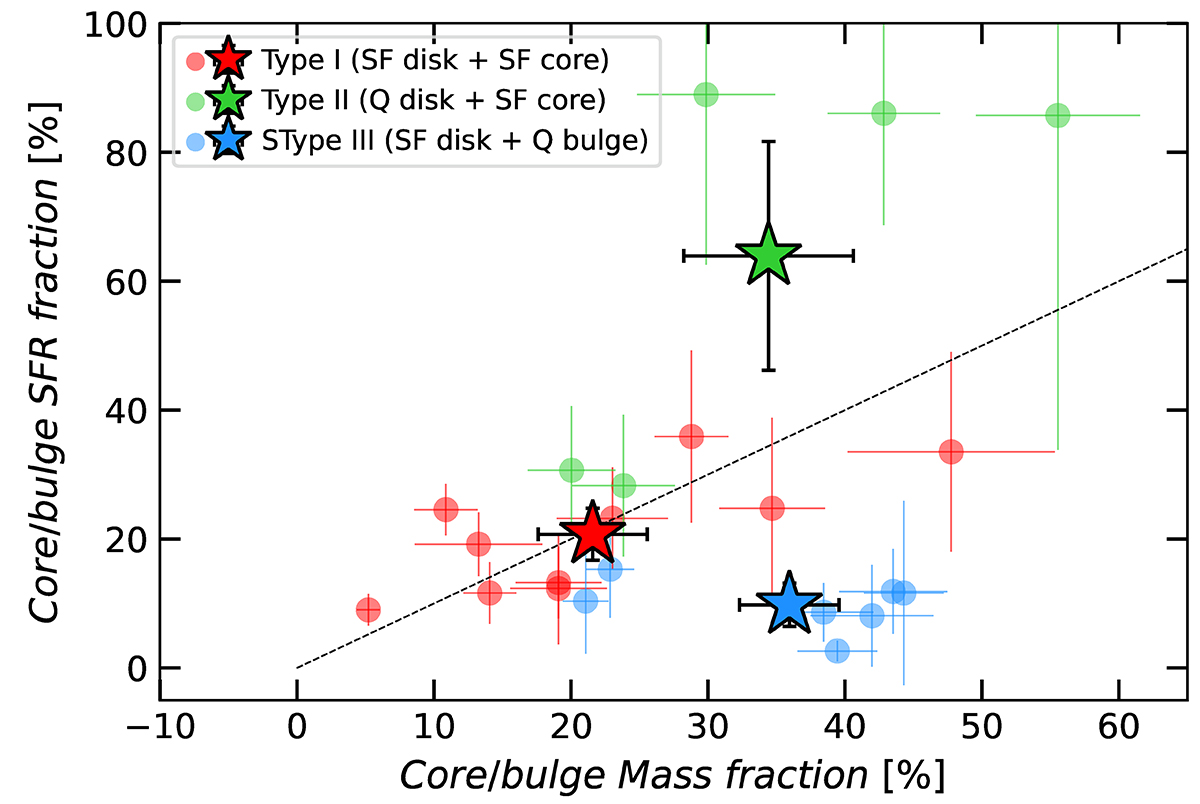
Fig. 19.
Download original image
Star-forming rate fraction versus M* fraction in the red region. The black dotted line is the 1:1 correlation. Circular markers are individual galaxies, star markers are the mean value for each Type of galaxy with their associated error bar indicating the error of the mean.
Current usage metrics show cumulative count of Article Views (full-text article views including HTML views, PDF and ePub downloads, according to the available data) and Abstracts Views on Vision4Press platform.
Data correspond to usage on the plateform after 2015. The current usage metrics is available 48-96 hours after online publication and is updated daily on week days.
Initial download of the metrics may take a while.