Open Access
Fig. 7.
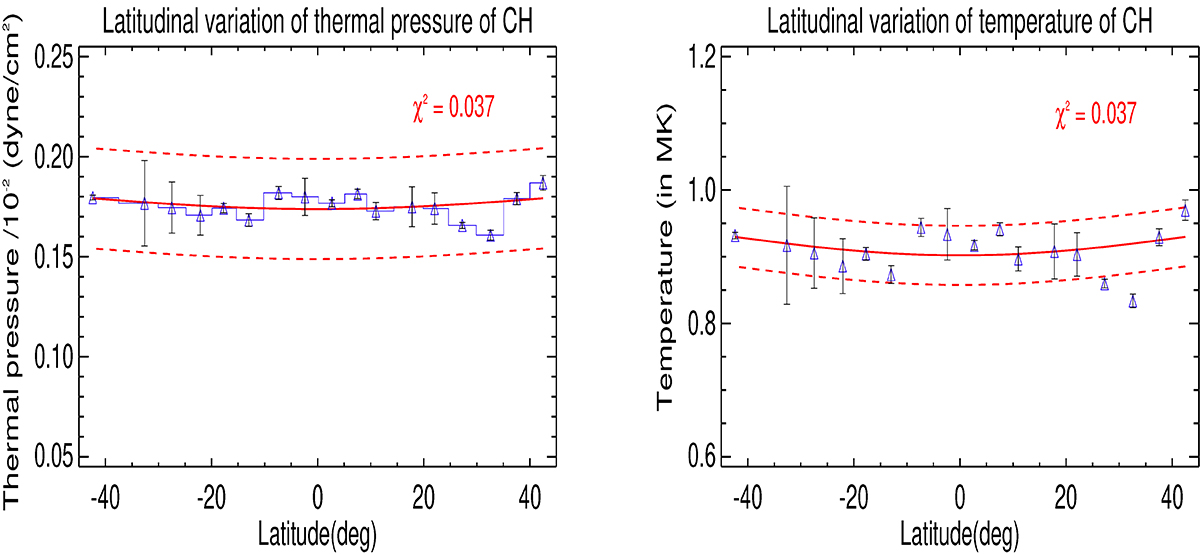
Download original image
Corona hole thermal pressure and temperature variation (shown as blue triangles) across latitudes. The continuous red line represents a least-squares fit and dashed red lines depict one standard deviation error bands computed from all data points. While χ2 serves as a measure of the goodness of fit.
Current usage metrics show cumulative count of Article Views (full-text article views including HTML views, PDF and ePub downloads, according to the available data) and Abstracts Views on Vision4Press platform.
Data correspond to usage on the plateform after 2015. The current usage metrics is available 48-96 hours after online publication and is updated daily on week days.
Initial download of the metrics may take a while.