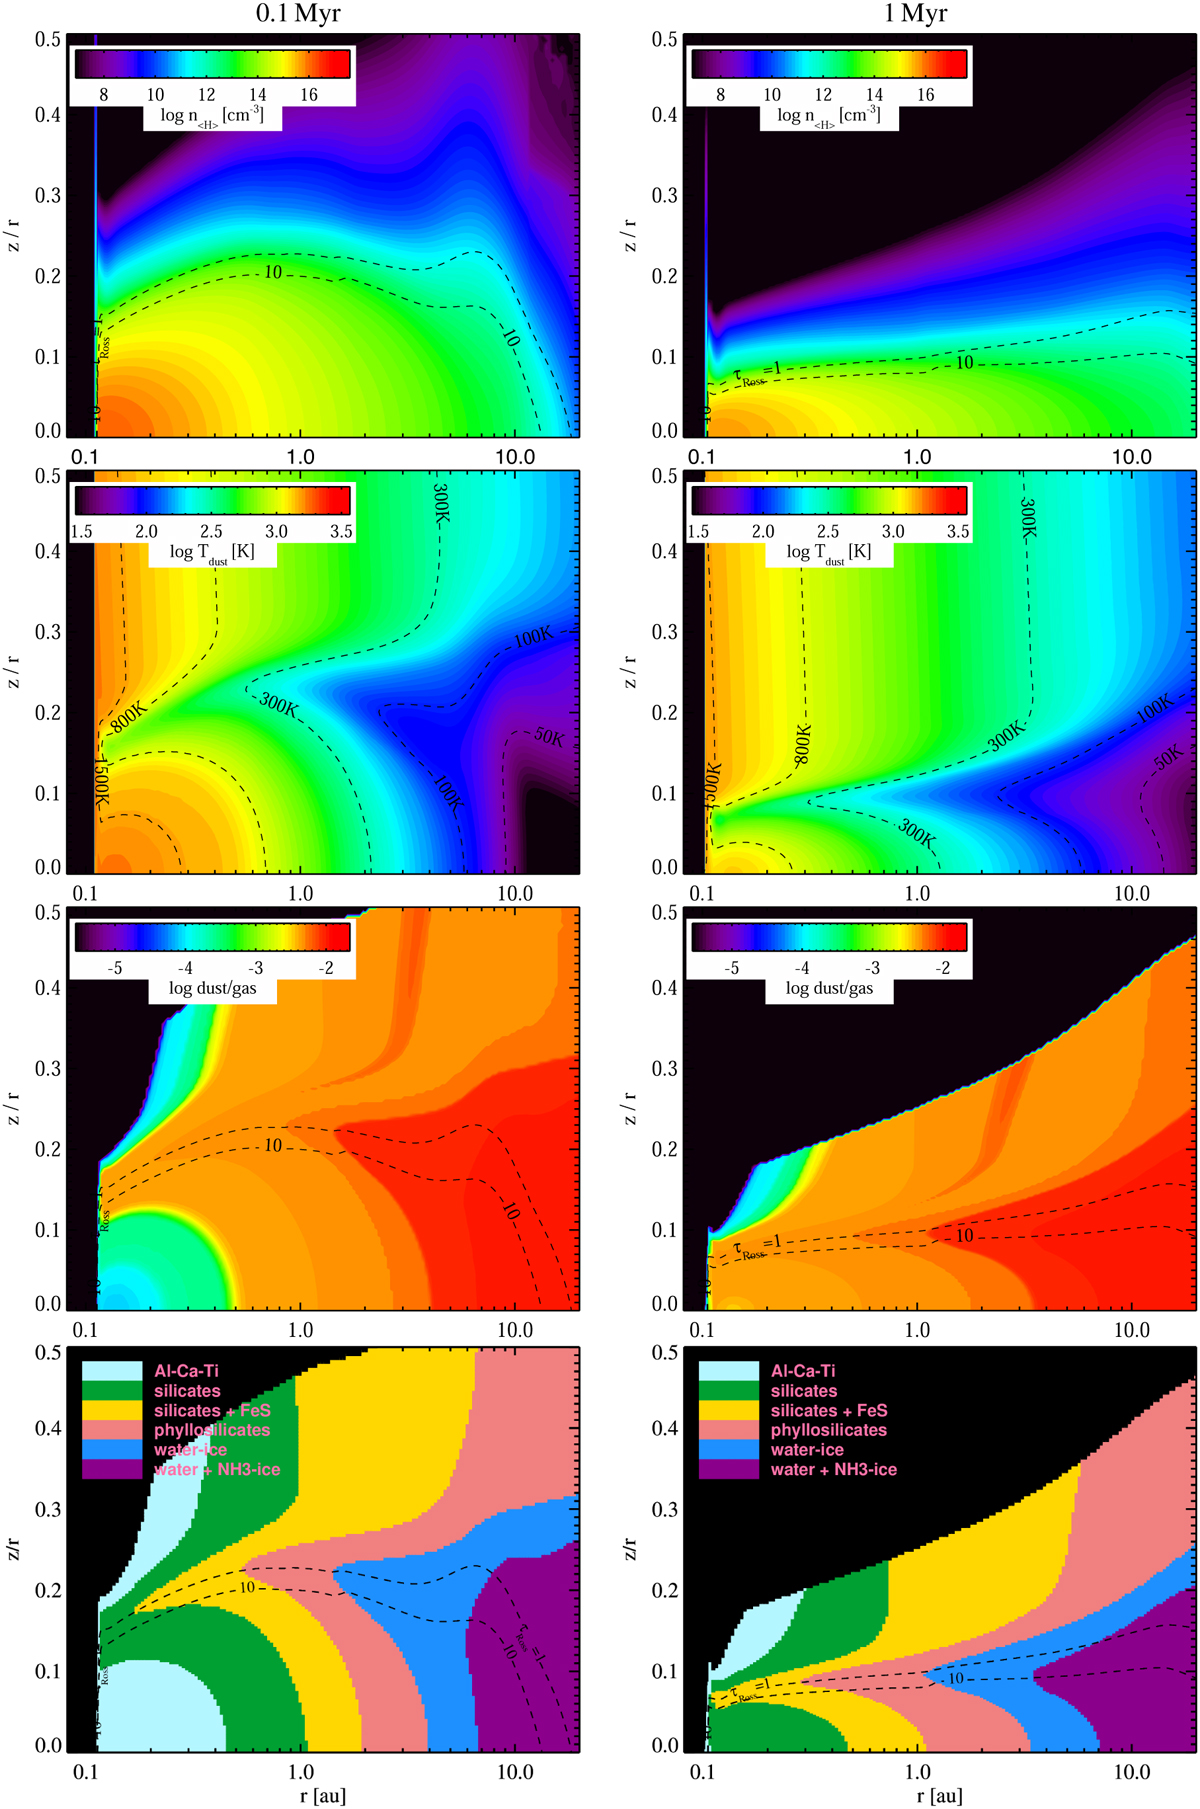
Fig. 3
Download original image
Selected 2D results of disc models after stage 3 as function of radius r and relative height over the midplane z/r. Upper row: hydrogen nuclei density n〈H〉(r, z). Second row: dust temperature structure Td(r, z). Third row: local dust-to-gas ratio. Bottom row: classes of solid mixtures(r, z); see Table 2. Additional dashed contour lines mark the vertical Rosseland optical depth τRoss = 1 and τRoss = 100. The black areas in plots in the two lower rows marks the end of the GGchem modelling domain n〈H〉 > 107 cm−3.
Current usage metrics show cumulative count of Article Views (full-text article views including HTML views, PDF and ePub downloads, according to the available data) and Abstracts Views on Vision4Press platform.
Data correspond to usage on the plateform after 2015. The current usage metrics is available 48-96 hours after online publication and is updated daily on week days.
Initial download of the metrics may take a while.