Fig. 2
Download original image
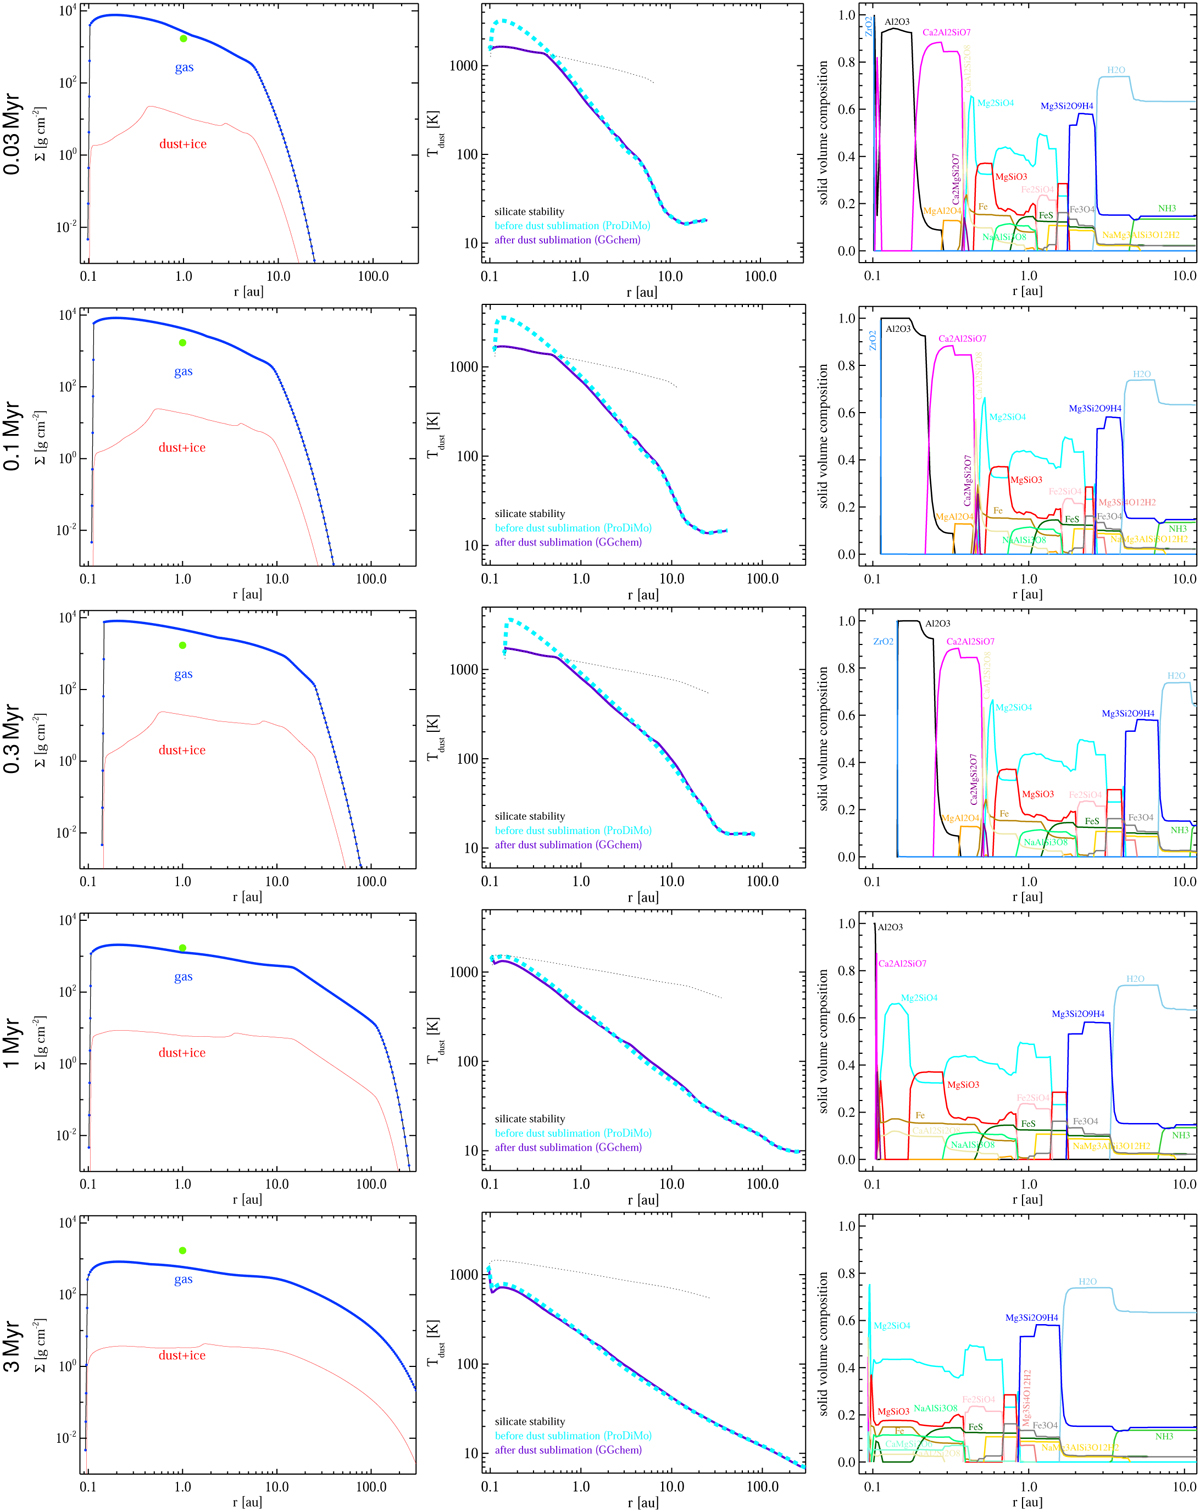
Evolution of gas and dust column densities (left column) and midplane temperatures (middle column) with ages indicated on the left. The green dots on the left mark the popular MMSN-value of 1700 g cm−2 at 1 au. The dashed cyan lines are the resulting midplane temperatures from the respective ProDiMo models, and the thick magenta lines are the midplane temperatures after dust sublimation. The dotted black line indicates the silicate stability temperature; see main text. The right column shows the material composition of the solid particles in the midplane.
Current usage metrics show cumulative count of Article Views (full-text article views including HTML views, PDF and ePub downloads, according to the available data) and Abstracts Views on Vision4Press platform.
Data correspond to usage on the plateform after 2015. The current usage metrics is available 48-96 hours after online publication and is updated daily on week days.
Initial download of the metrics may take a while.