Fig. 4
Download original image
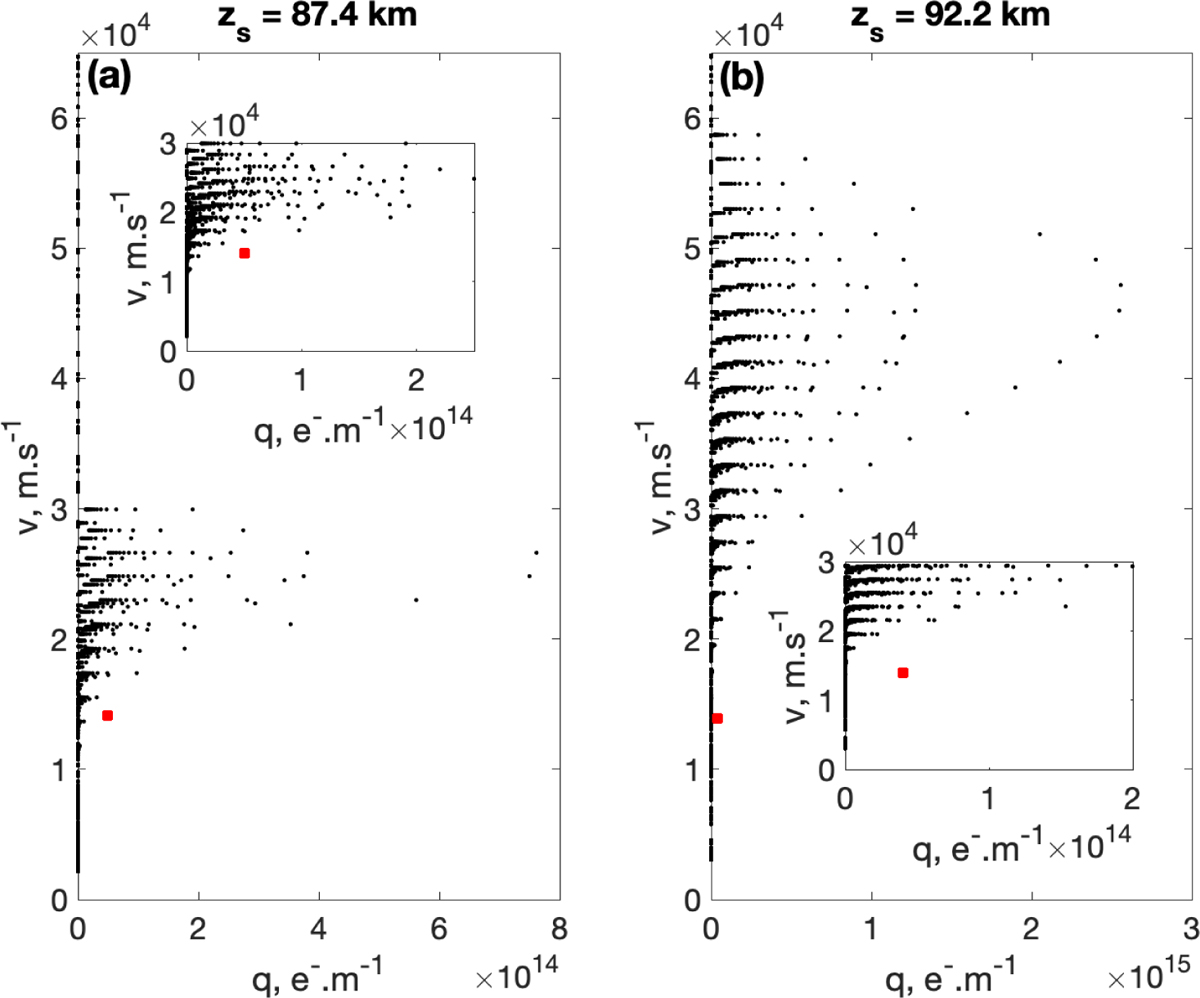
Two detected example in which the mass determination methodology did not work. Left: the filled red square denotes the particle qs and υs at altitude zs. The black data points represent the q versus υ values of all CABMOD profiles at zs. For the particle mass range that CABMOD uses (<2774 μg), CABMOD predicts that a particle with an entry angle, υs and qs matching the particle should have completely ablated at zs (i.e. not producing any ionization such that q=0 e− m−1). The insert boxes are a zomm in of the portion of the figure around the red dots. The periodic pattern in the modeled results is due to the resolution in υ, m and α of CABMOD.
Current usage metrics show cumulative count of Article Views (full-text article views including HTML views, PDF and ePub downloads, according to the available data) and Abstracts Views on Vision4Press platform.
Data correspond to usage on the plateform after 2015. The current usage metrics is available 48-96 hours after online publication and is updated daily on week days.
Initial download of the metrics may take a while.