Open Access
Fig. 6
Download original image
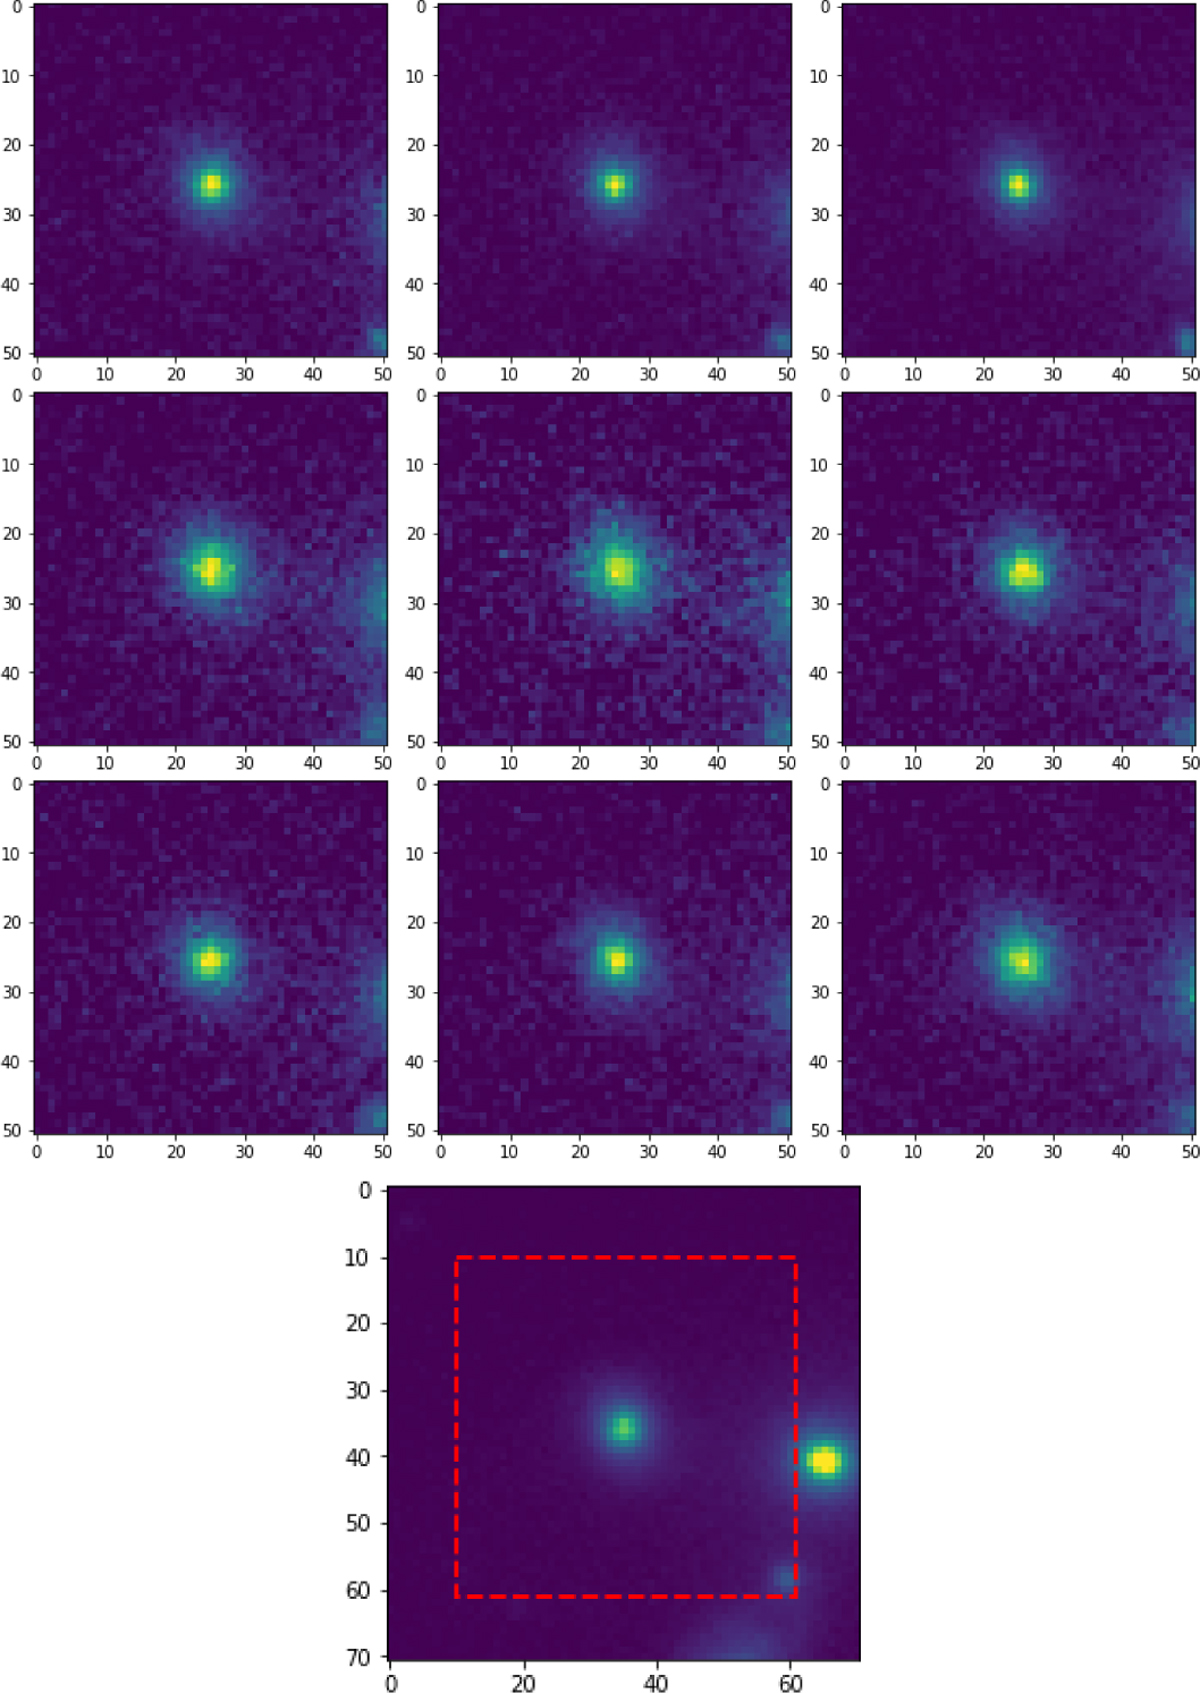
Thumbnails of the flagged epochs for source 23 560 (including epoch 32, which was excluded from Fig. A.1). The last panel is a broader view of the stacked image showing the nearby contaminant; the size of the previous thumbnails is shown by the red dashed square.
Current usage metrics show cumulative count of Article Views (full-text article views including HTML views, PDF and ePub downloads, according to the available data) and Abstracts Views on Vision4Press platform.
Data correspond to usage on the plateform after 2015. The current usage metrics is available 48-96 hours after online publication and is updated daily on week days.
Initial download of the metrics may take a while.