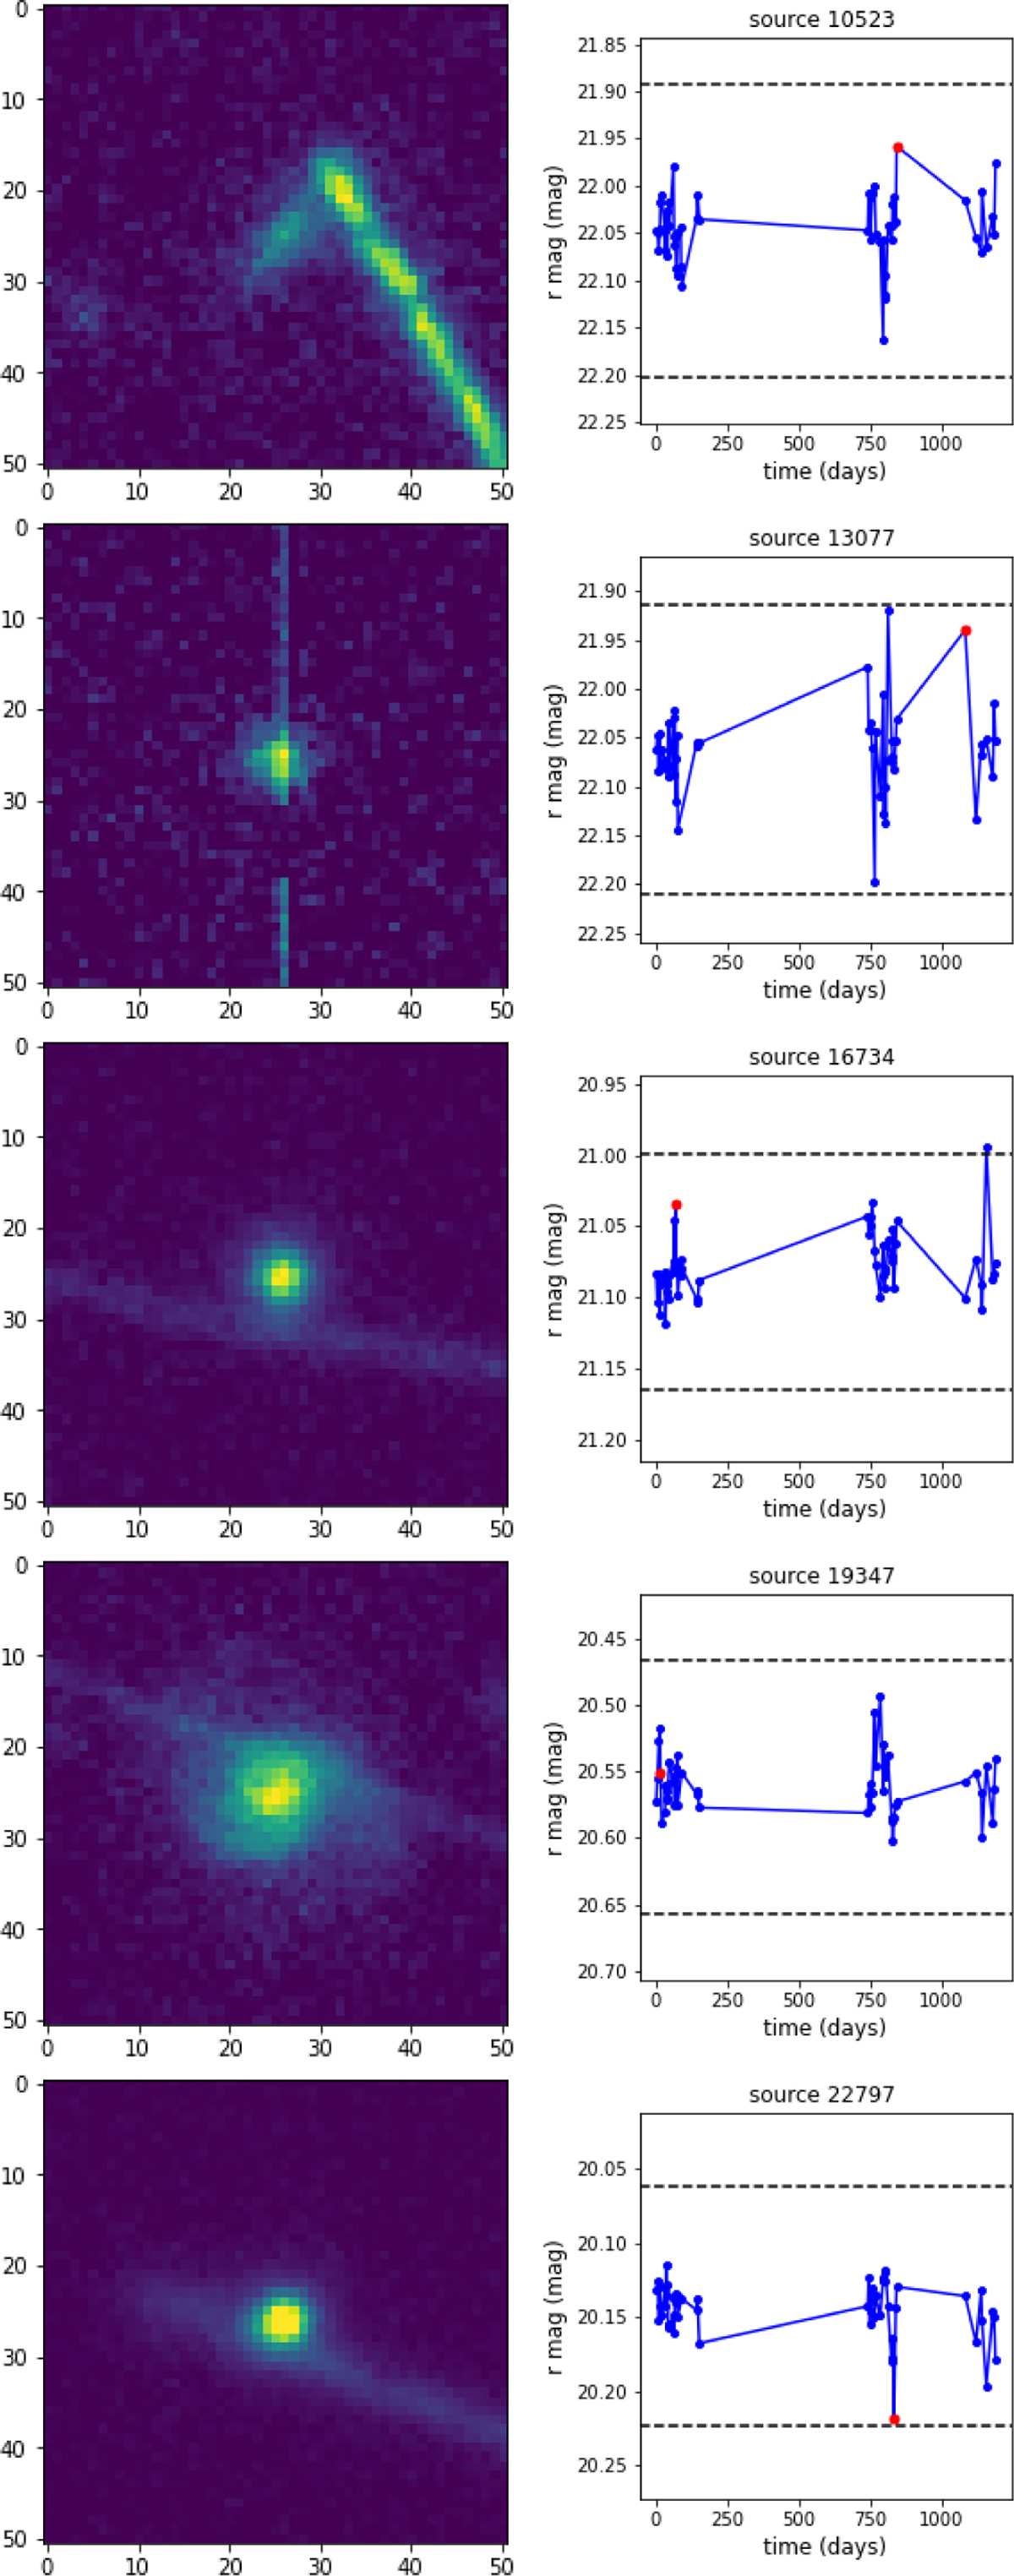
Fig. 10
Download original image
Some of the problematic objects identified by our method. In most cases, if a track appears, it is closer to the object with respect to the aperture photometry, so it slightly affects the flux measurement. In the left column, one can see the image as identified by our algorithm, while in the right we report the light curve with the flagged epoch marked with red. The horizontal lines represent the threshold of the sigma clip. (See Figs. A.3 and A.4 for the whole sample.)
Current usage metrics show cumulative count of Article Views (full-text article views including HTML views, PDF and ePub downloads, according to the available data) and Abstracts Views on Vision4Press platform.
Data correspond to usage on the plateform after 2015. The current usage metrics is available 48-96 hours after online publication and is updated daily on week days.
Initial download of the metrics may take a while.