Fig. 1
Download original image
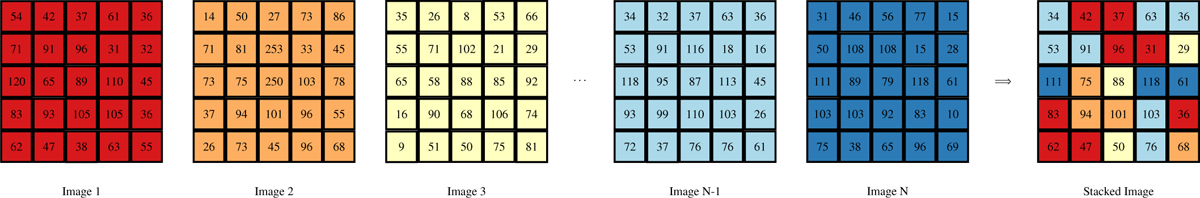
Example derivation of our stacked image starting from individual images. The individual images are represented by simple 5 × 5 matrices. The median value for each cell is selected in order to derive the stacked image. This process is suitable to avoiding wrong values in single epochs. For example, the values above 250 in Image 2 have been removed completely, as when using the mean value, the presence of such values, although mitigated by the number of independent images, would affect the final result much more.
Current usage metrics show cumulative count of Article Views (full-text article views including HTML views, PDF and ePub downloads, according to the available data) and Abstracts Views on Vision4Press platform.
Data correspond to usage on the plateform after 2015. The current usage metrics is available 48-96 hours after online publication and is updated daily on week days.
Initial download of the metrics may take a while.