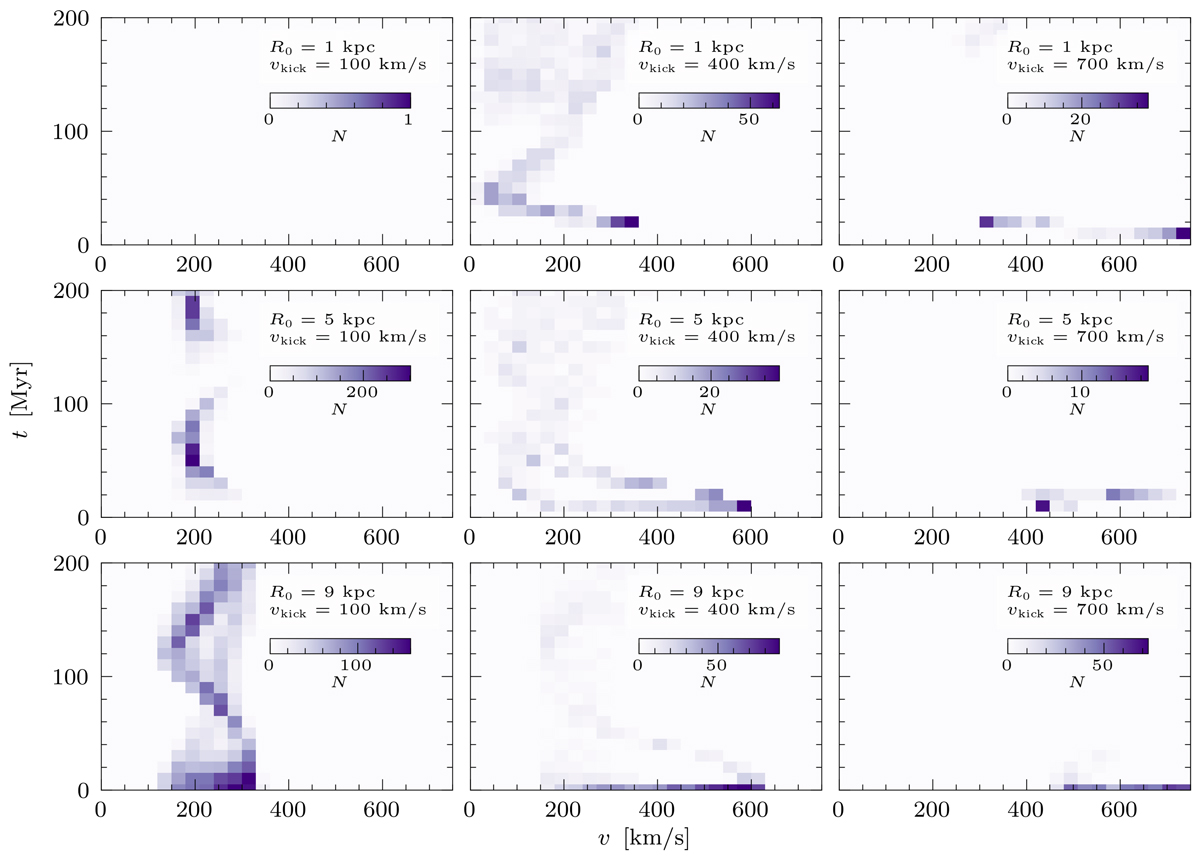
Fig. 7.
Download original image
Grid of simulations of 103 kicked objects, similar to Fig. 6, but showing only the objects that are in the solar neighbourhood. Again, these simulations have a fixed initial galactocentric radius, R0 (rows: 1 kpc, 5 kpc, and 9 kpc), and a single value for vkick (columns: 100 km s−1, 400 km s−1, and 700 km s−1). Similarly to Fig. 6, the evolution of the galactocentric velocity (v) is shown through 2D histograms with time bins of 10 Myr and velocity bins of 30 km s−1. However, since the sizes of the populations in the panels differ significantly, they are shown on different colour scales.
Current usage metrics show cumulative count of Article Views (full-text article views including HTML views, PDF and ePub downloads, according to the available data) and Abstracts Views on Vision4Press platform.
Data correspond to usage on the plateform after 2015. The current usage metrics is available 48-96 hours after online publication and is updated daily on week days.
Initial download of the metrics may take a while.