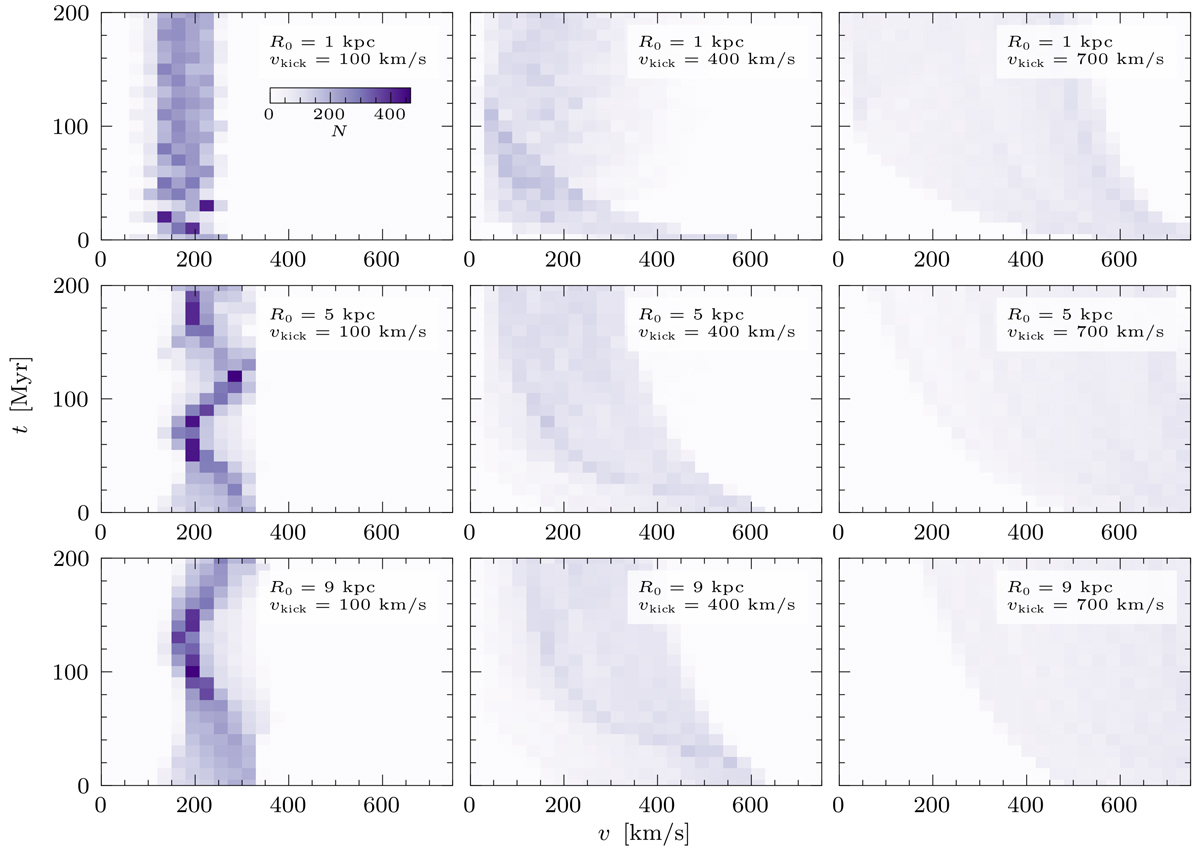
Fig. 6.
Download original image
Grid of simulations of 103 kicked objects, with a fixed initial galactocentric radius, R0 (rows: 1 kpc, 5 kpc, and 9 kpc), and a single value for vkick (columns: 100 km s−1, 400 km s−1, and 700 km s−1). The figure shows the evolution of the galactocentric velocity (v) of the total population, in 2D histograms with time bins of 10 Myr and velocity bins of 30 km s−1. Even though these simulations use a single value for vkick, the velocity distributions do not start as delta functions, because of the vcirc term in Eq. (2).
Current usage metrics show cumulative count of Article Views (full-text article views including HTML views, PDF and ePub downloads, according to the available data) and Abstracts Views on Vision4Press platform.
Data correspond to usage on the plateform after 2015. The current usage metrics is available 48-96 hours after online publication and is updated daily on week days.
Initial download of the metrics may take a while.