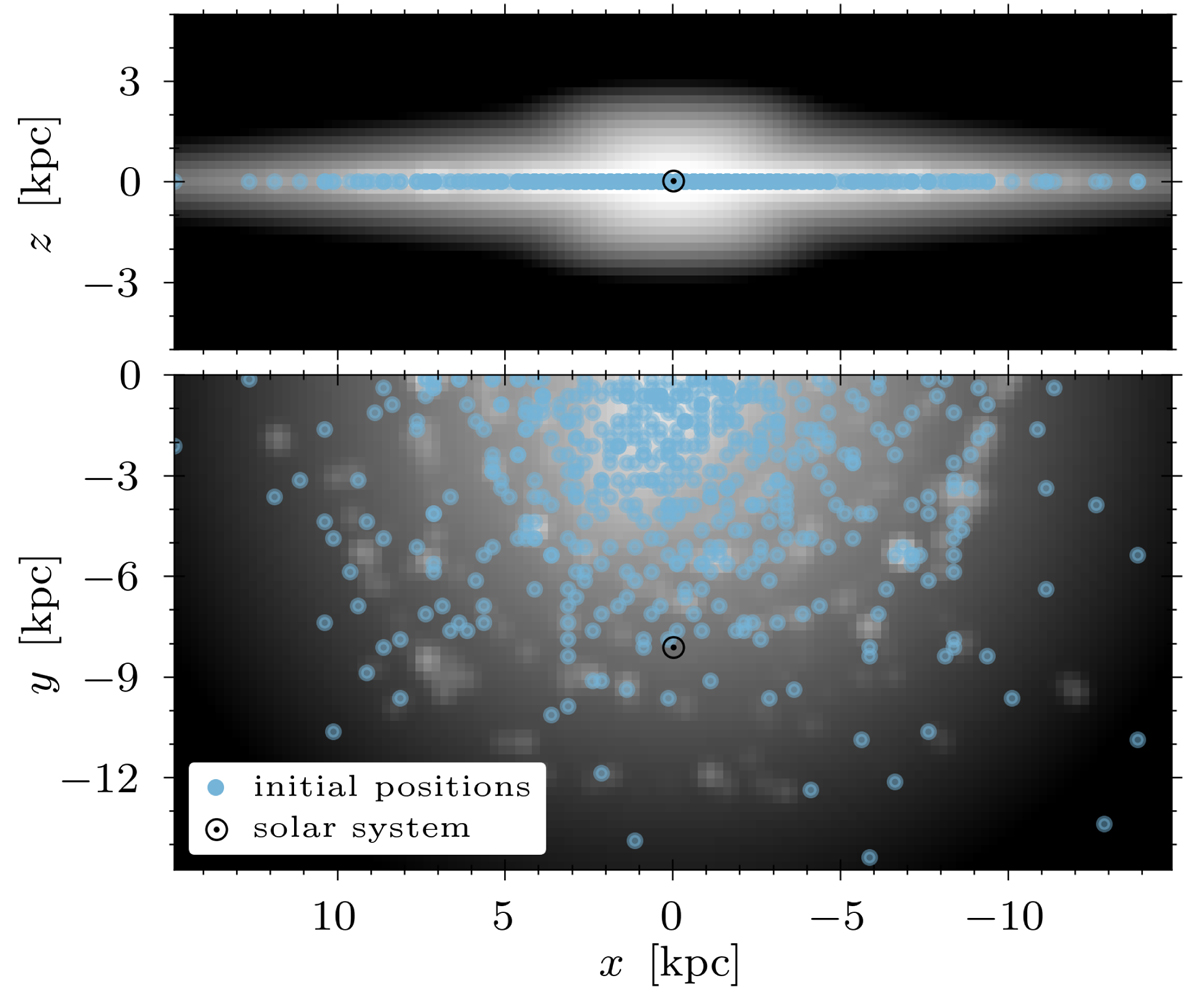
Fig. 1.
Download original image
Initial positions of point masses in our simulation (blue dots), plotted over the synthetic MW image, based on the works of Gaspari et al. (2024) and Chrimes et al. (2021), as described in the main text. The figure contains 500 of the 104 simulated point masses. The Sun symbol represents the Solar System, at R⊙ = 8.122 kpc and z⊙ = 20.8 pc.
Current usage metrics show cumulative count of Article Views (full-text article views including HTML views, PDF and ePub downloads, according to the available data) and Abstracts Views on Vision4Press platform.
Data correspond to usage on the plateform after 2015. The current usage metrics is available 48-96 hours after online publication and is updated daily on week days.
Initial download of the metrics may take a while.