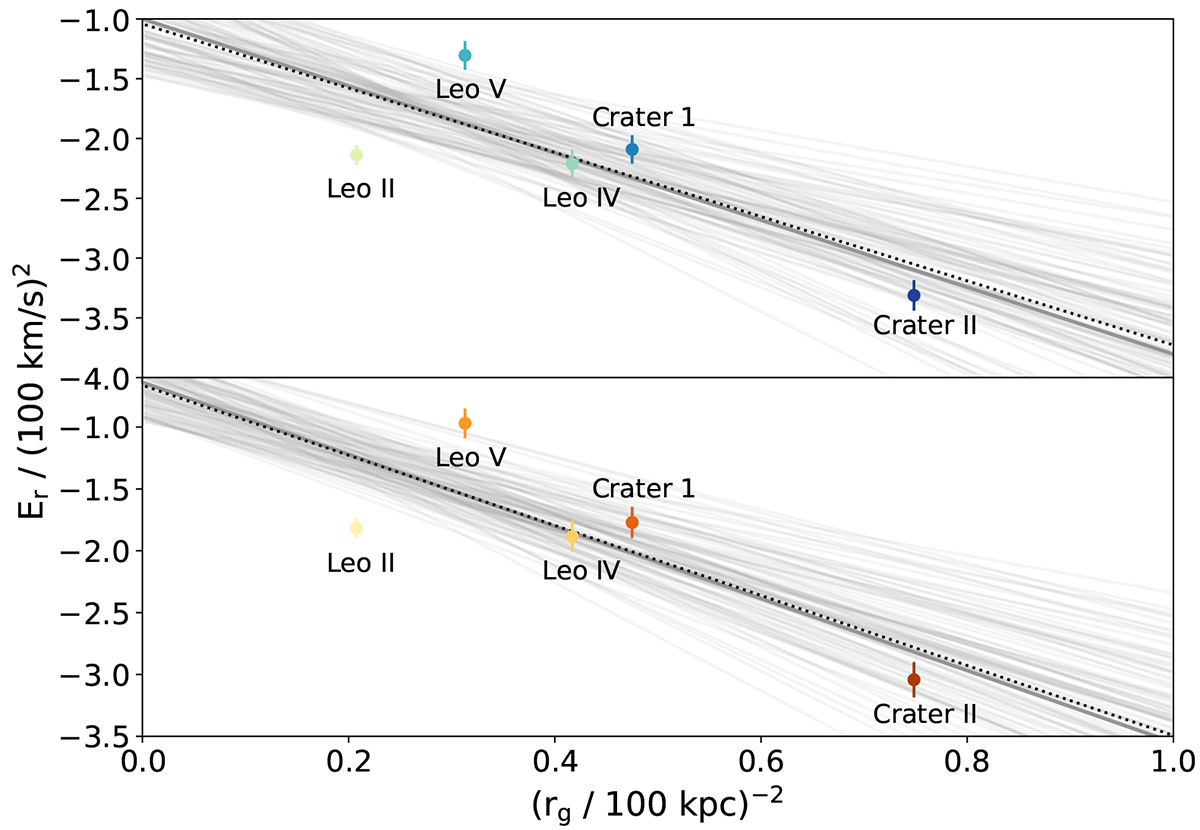
Fig. 4.
Download original image
Er plotted against r−2 for the proposed group. The coloured points represent the measured quantities and the associated uncertainties for each object. The grey solid line shows the fit that we get from the Lynden-Bell method by assuming that the objects under study share E and h. The dashed lines represent the mean fit obtained from the MCMC method, with the thin solid lines representing 100 random realisations of it. Top: fit using MW-only potential. Bottom: fit using the MW+LMC potential.
Current usage metrics show cumulative count of Article Views (full-text article views including HTML views, PDF and ePub downloads, according to the available data) and Abstracts Views on Vision4Press platform.
Data correspond to usage on the plateform after 2015. The current usage metrics is available 48-96 hours after online publication and is updated daily on week days.
Initial download of the metrics may take a while.