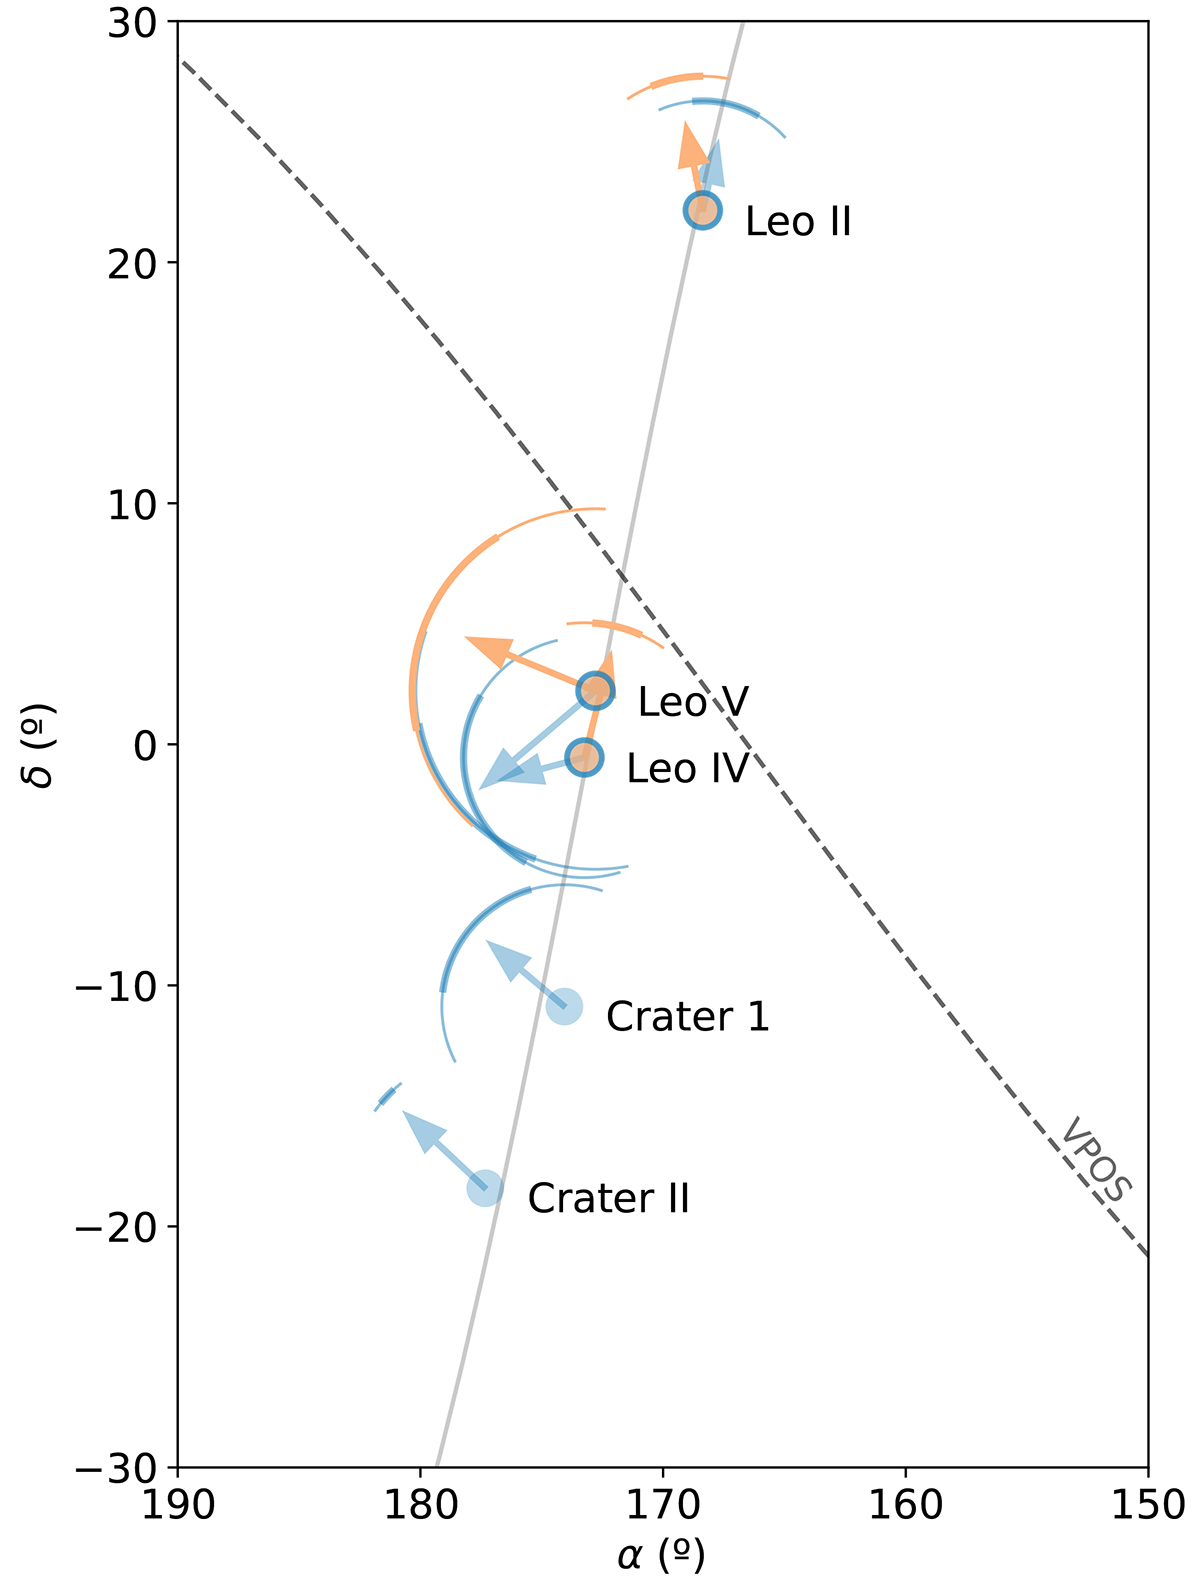
Fig. 2.
Download original image
Positions of Leo II, Leo IV, Leo V, Crater 1, and Crater II in the sky. The solid grey line represents the great circle with the pole at (α, δ) = (263.01° ,10.78° ) that passes close to all five satellites. The black dashed line represents the best-fit orbital plane of the VPOS at (α, δ) = (76.53° ,36.24° ) estimated by Fritz et al. (2018). The arrows indicate the most likely direction of motion based on current proper motion estimates (the fainter ones, in blue, represent the Gaia measurements, and the solid ones, in orange, the HST proper motions) and the circle segments indicate the 1 and 2σ uncertainties in the velocity directions of the satellites.
Current usage metrics show cumulative count of Article Views (full-text article views including HTML views, PDF and ePub downloads, according to the available data) and Abstracts Views on Vision4Press platform.
Data correspond to usage on the plateform after 2015. The current usage metrics is available 48-96 hours after online publication and is updated daily on week days.
Initial download of the metrics may take a while.