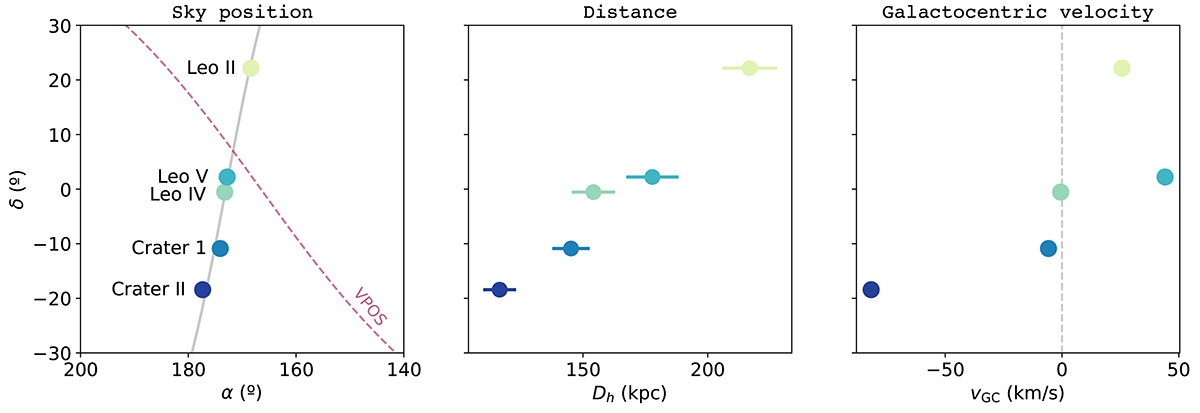
Fig. 1.
Download original image
Crater-Leo objects. The left-hand panel shows the positions of Leo II, Leo IV, Leo V, Crater 1, and Crater II in the sky. The solid grey line represents the great circle with the pole at (α, δ) = (263.01° ,10.78° ) that passes close to all five satellites. The red dashed line represents the best-fit orbital plane of the VPOS at (α, δ) = (76.53° ,36.24° ) estimated by Fritz et al. (2018). The middle panel represents the declination versus the heliocentric distance of the satellites. The right-hand panel shows the declination versus line-of-sight velocity of the satellites, with vGC = 0 kms−1 represented by the dashed line.
Current usage metrics show cumulative count of Article Views (full-text article views including HTML views, PDF and ePub downloads, according to the available data) and Abstracts Views on Vision4Press platform.
Data correspond to usage on the plateform after 2015. The current usage metrics is available 48-96 hours after online publication and is updated daily on week days.
Initial download of the metrics may take a while.