Fig. 3
Download original image
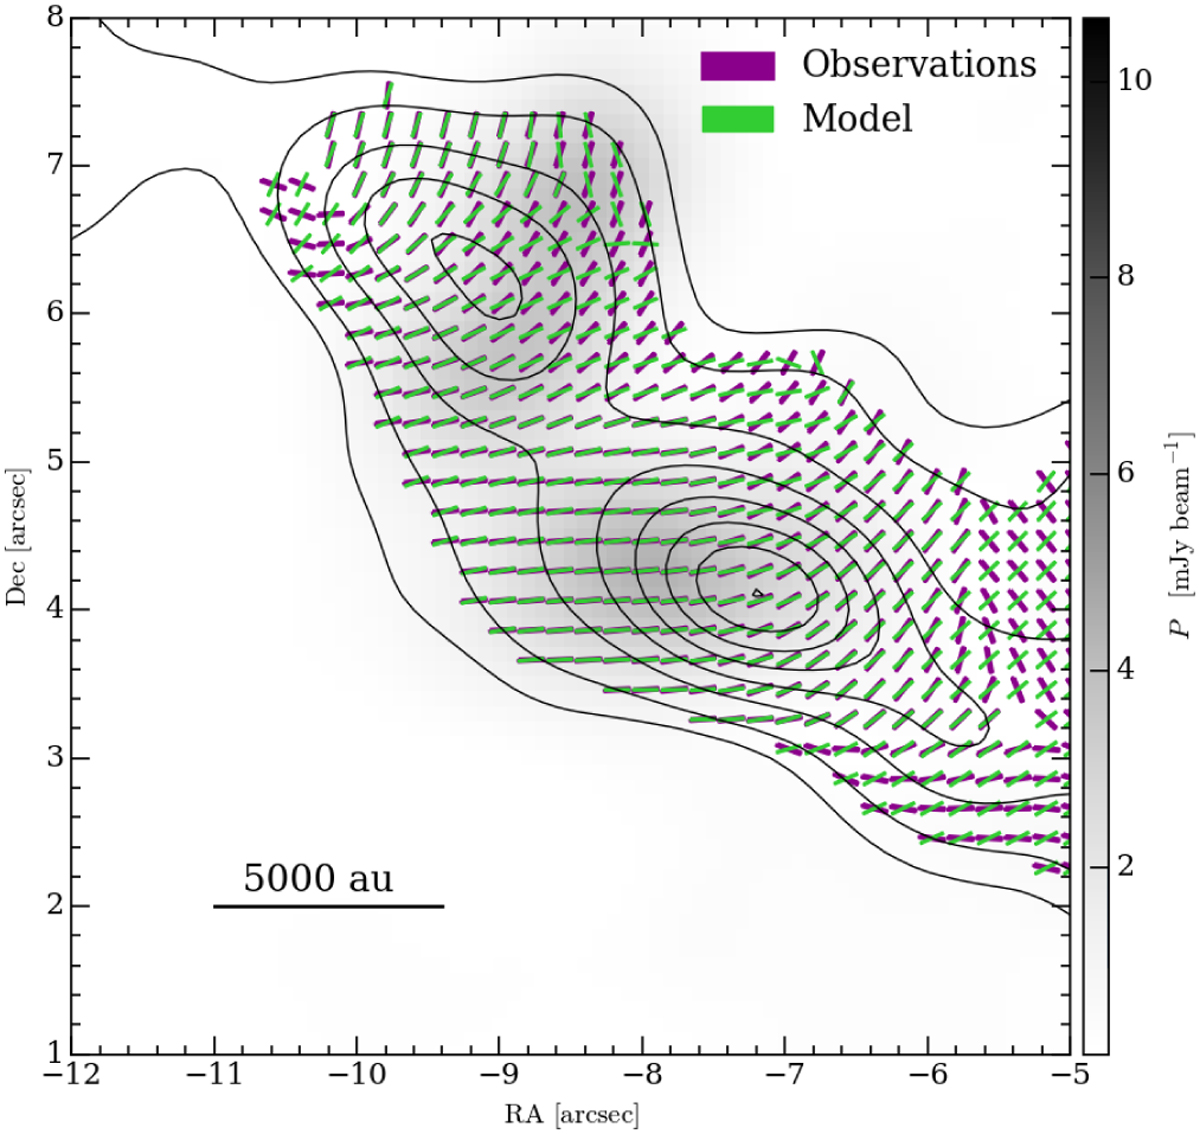
Map of polarization segments (rotated by 90°) and polarized intensity P (greyscale) in the NE1-NE2 filament in the high-mass star-forming region G327.7: observations (purple), from Beuther et al. (2020); best-fit model (green). The black contours show the observed 1.3 mm dust emission intensity starting from 3σ in steps of 6σ.
Current usage metrics show cumulative count of Article Views (full-text article views including HTML views, PDF and ePub downloads, according to the available data) and Abstracts Views on Vision4Press platform.
Data correspond to usage on the plateform after 2015. The current usage metrics is available 48-96 hours after online publication and is updated daily on week days.
Initial download of the metrics may take a while.