Open Access
Fig. 5
Download original image
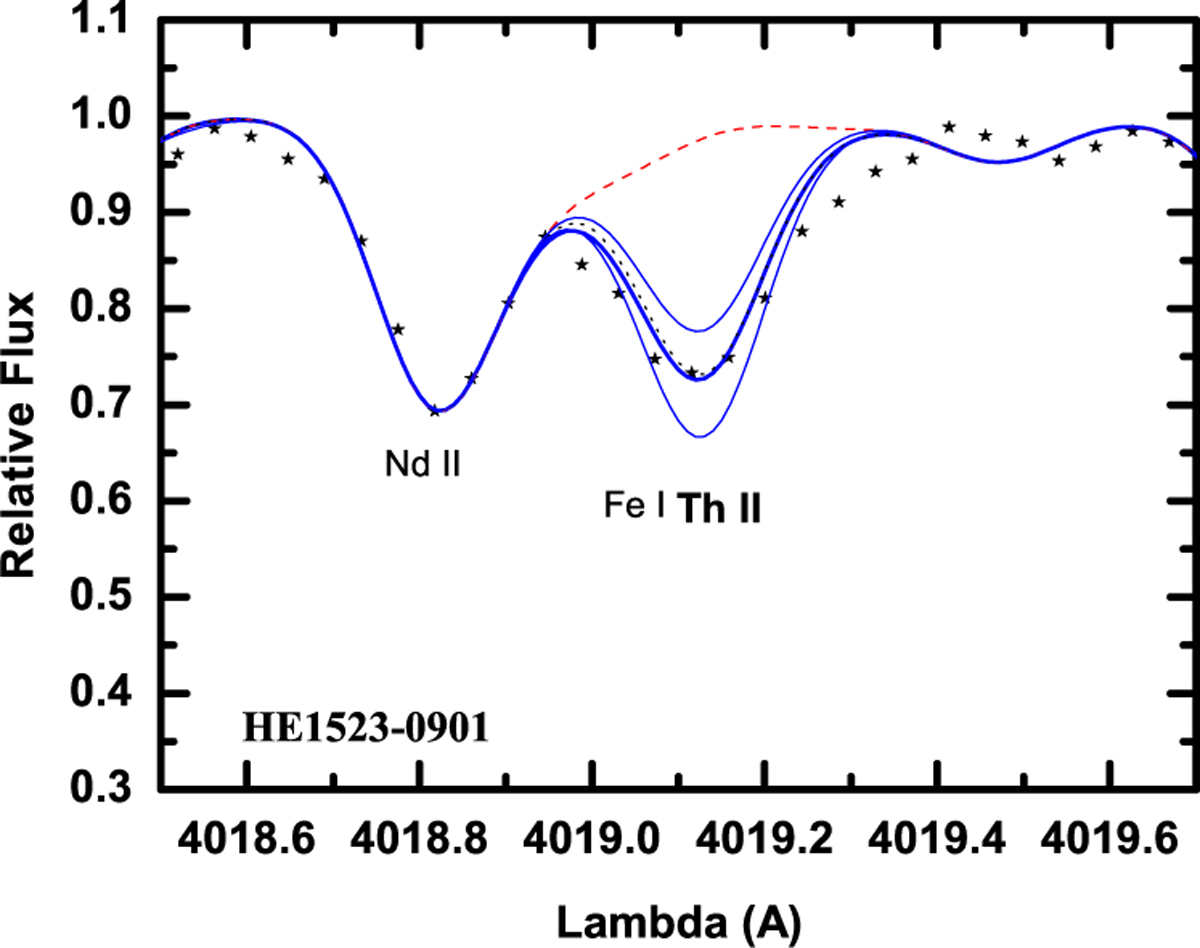
Observed (asterisks) and calculated (solid and dashed lines) spectra in the region of Th II line for HE 1523-0901. The impact of the Th abundance variation of 0.20 dex and without any Th contribution (dashed line) is shown.
Current usage metrics show cumulative count of Article Views (full-text article views including HTML views, PDF and ePub downloads, according to the available data) and Abstracts Views on Vision4Press platform.
Data correspond to usage on the plateform after 2015. The current usage metrics is available 48-96 hours after online publication and is updated daily on week days.
Initial download of the metrics may take a while.