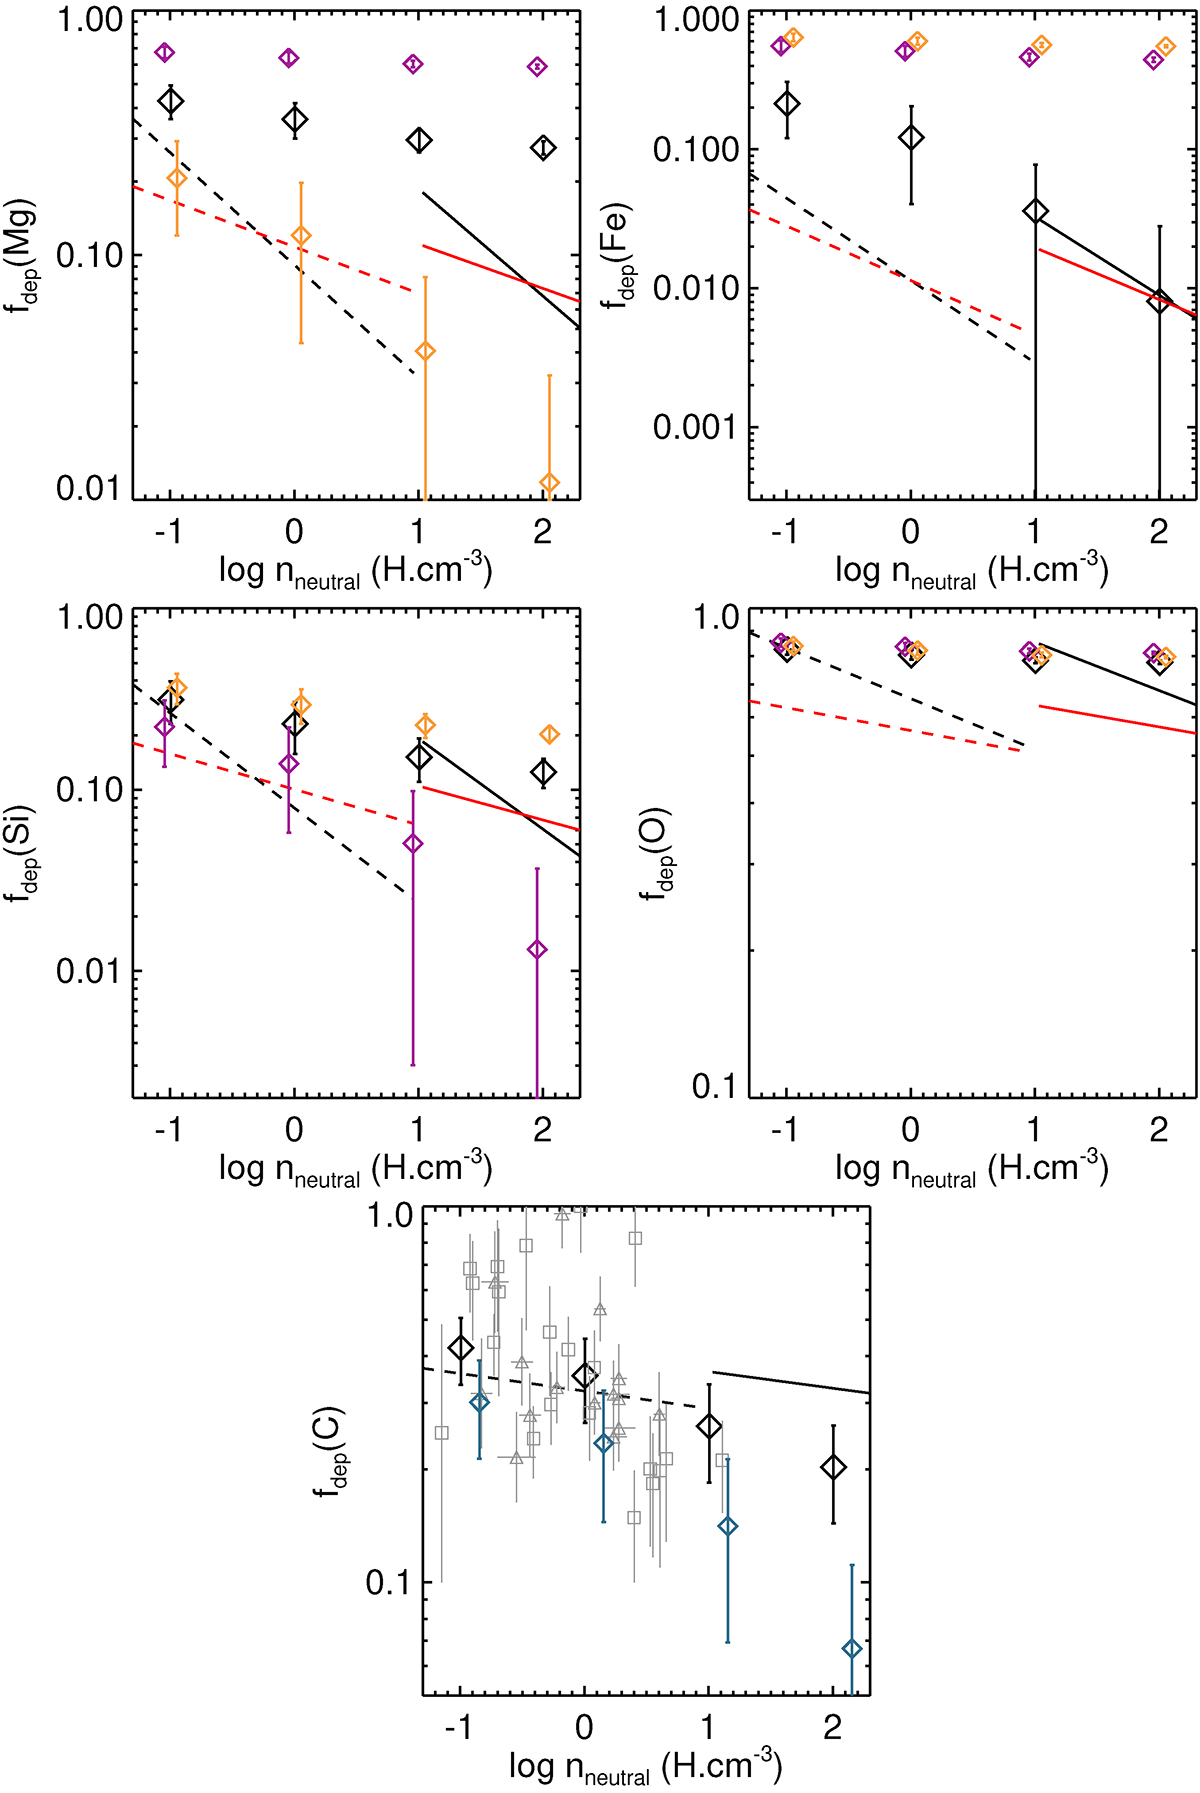
Fig. 7.
Download original image
Depletion factors as a function of gas density for the G10LG simulation at 400 Myr (black diamonds with standard deviation) compared to the results from Jenkins (2009; black dashed lines) and from De Cia et al. (2016; red dashed lines). The solid lines are the rescaled observational fits following Zhukovska et al. (2016). The purple and orange diamonds are the depletion factors for the G10LG simulation using a pyroxene compound (MgFeSi2O6), and an iron-poor olivine compound (Mg1.5Fe0.5SiO4), respectively, instead of the default olivine compound (MgFeSiO4) for silicates. The blue diamonds stand for the G10LG simulation without CO formation. For C depletion, we also show the data points from Jenkins (2009; triangles) and Parvathi et al. (2012; squares).
Current usage metrics show cumulative count of Article Views (full-text article views including HTML views, PDF and ePub downloads, according to the available data) and Abstracts Views on Vision4Press platform.
Data correspond to usage on the plateform after 2015. The current usage metrics is available 48-96 hours after online publication and is updated daily on week days.
Initial download of the metrics may take a while.