Fig. 6.
Download original image
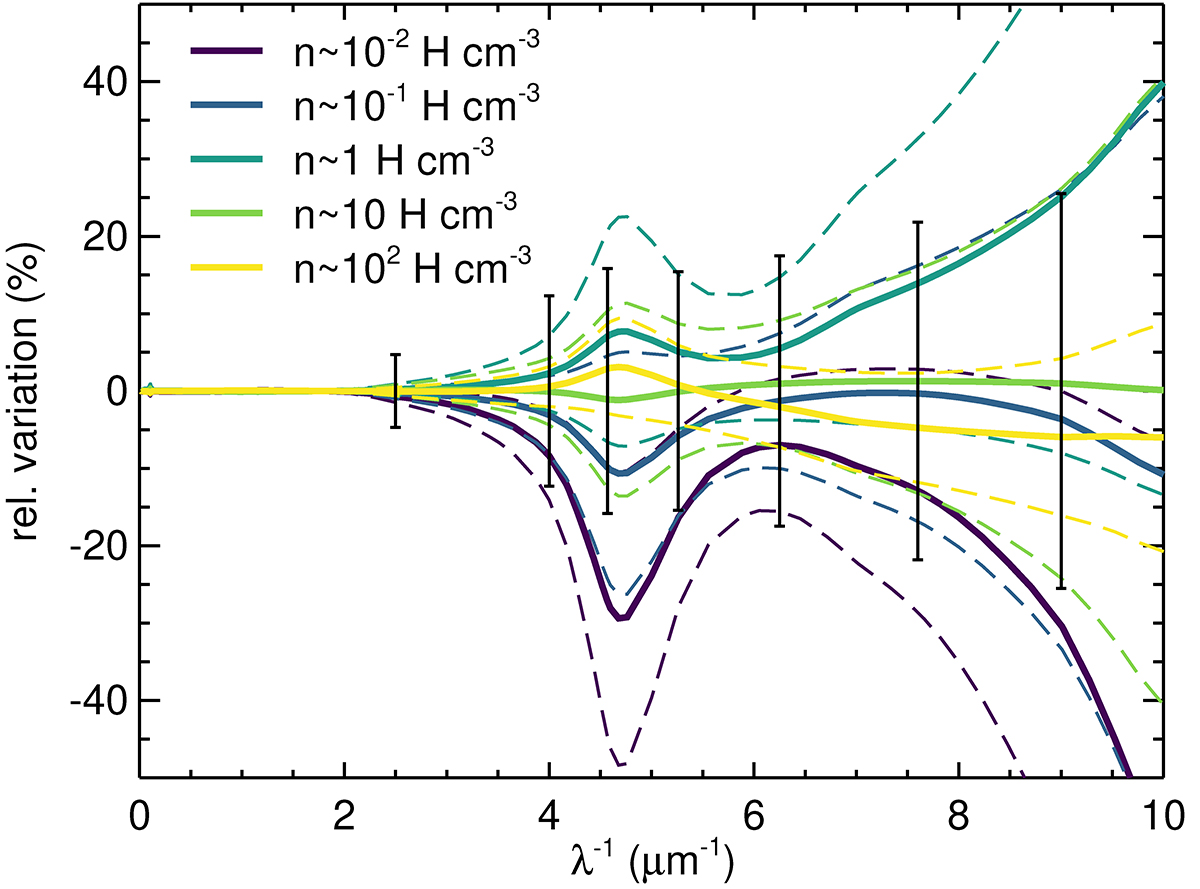
Relative variations of the mean extinction curve δ(Aλ/AV)|n (solid line) at a given gas density (color-coded as indicated in the panel) with respect to the galactic extinction curve in the G10LG simulation at t = 400 Myr. The dashed lines indicate the 1-σ scatter for each sampled density. The error bars stand for the scatter of the observed extinction curves of the Milky Way from Fitzpatrick & Massa (2007) relative to the mean extinction curve from Pei (1992).
Current usage metrics show cumulative count of Article Views (full-text article views including HTML views, PDF and ePub downloads, according to the available data) and Abstracts Views on Vision4Press platform.
Data correspond to usage on the plateform after 2015. The current usage metrics is available 48-96 hours after online publication and is updated daily on week days.
Initial download of the metrics may take a while.