Fig. 5.
Download original image
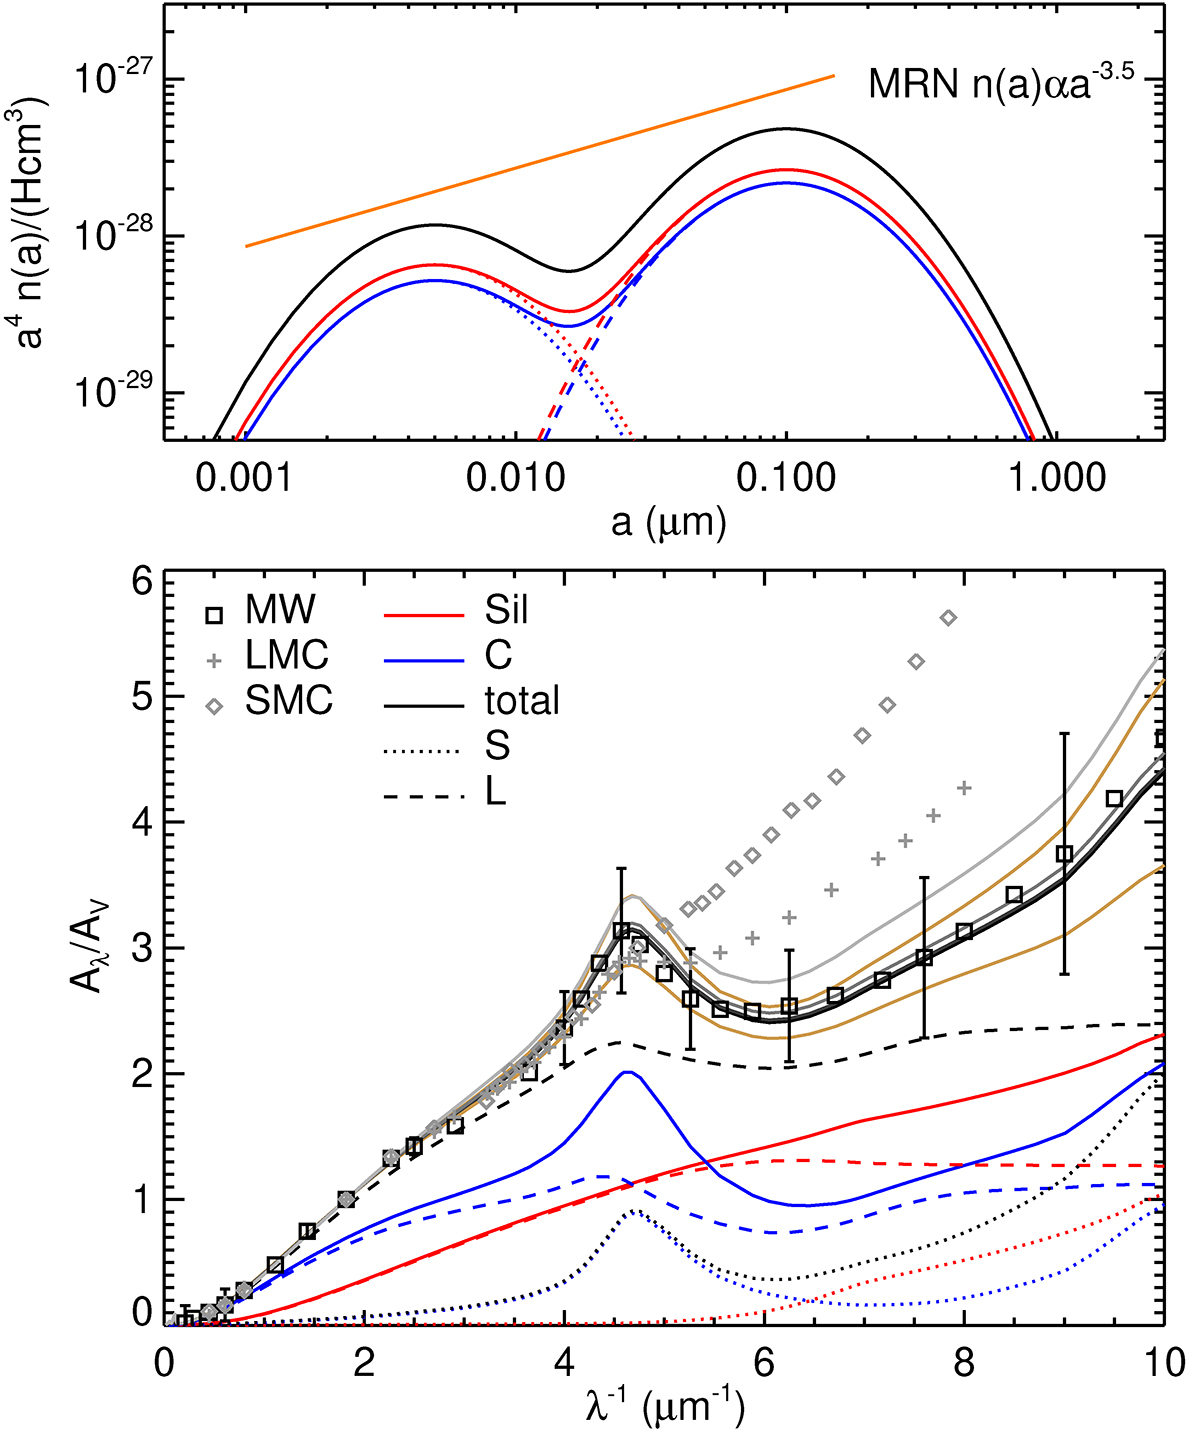
Respectively top and bottom panels: dust size distribution and extinction curve obtained from the fiducial G10LG simulation at t = 400 Myr for the total dust content (black solid), and the contribution from carbonaceous (blue, ’C’), silicate (red, ’Sil’) grains, and small (dotted, ’S’) and large grains (dashed, ’L’). The extinction curves at different times t = 100, 200, 300, and 400 Myr are shown from light to dark grey scales. The scatter of the extinction curves from the simulation are the brown solid lines. The dust size distribution is compared to that of the Mathis et al. (1977; MRN) size distribution in the Milky Way (in orange). The extinction from the Milky Way (MW), Large Magellanic Cloud (LMC), and Small Magellanic Cloud (SMC) from Pei (1992) are shown as labelled in the corresponding panel, with the typical scatter estimated from the data of Fitzpatrick & Massa (2007). Our simulated MW analogue is in remarkably good agreement with the MRN size distribution and the MW extinction curve.
Current usage metrics show cumulative count of Article Views (full-text article views including HTML views, PDF and ePub downloads, according to the available data) and Abstracts Views on Vision4Press platform.
Data correspond to usage on the plateform after 2015. The current usage metrics is available 48-96 hours after online publication and is updated daily on week days.
Initial download of the metrics may take a while.