Fig. E.1.
Download original image
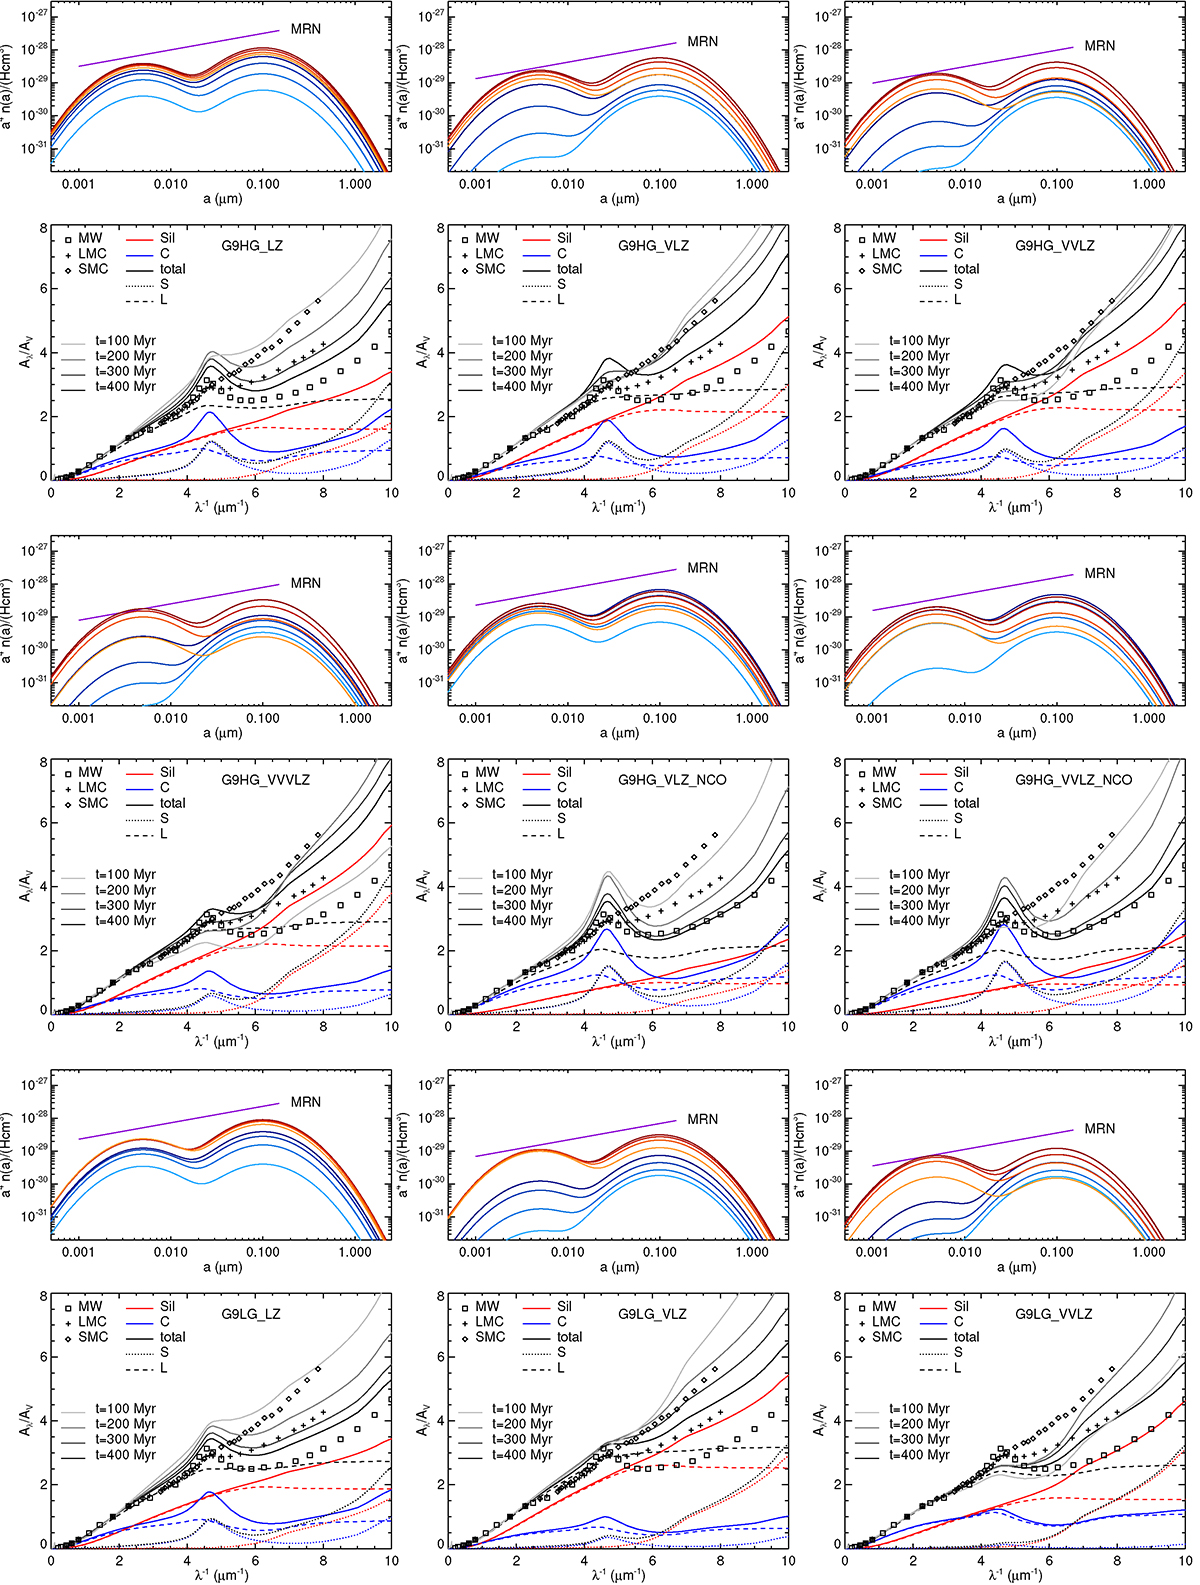
Size distribution of grains and extinction curves at different times for different simulations as indicated in the panel. The colors (red and blue) indicate the contribution from different chemical compositions of the dust (resp. silicate and carbonaceous grains), and we only show this decomposition in the extinction curve for the final time of the simulation.
Current usage metrics show cumulative count of Article Views (full-text article views including HTML views, PDF and ePub downloads, according to the available data) and Abstracts Views on Vision4Press platform.
Data correspond to usage on the plateform after 2015. The current usage metrics is available 48-96 hours after online publication and is updated daily on week days.
Initial download of the metrics may take a while.