Open Access
Fig. 22.
Download original image
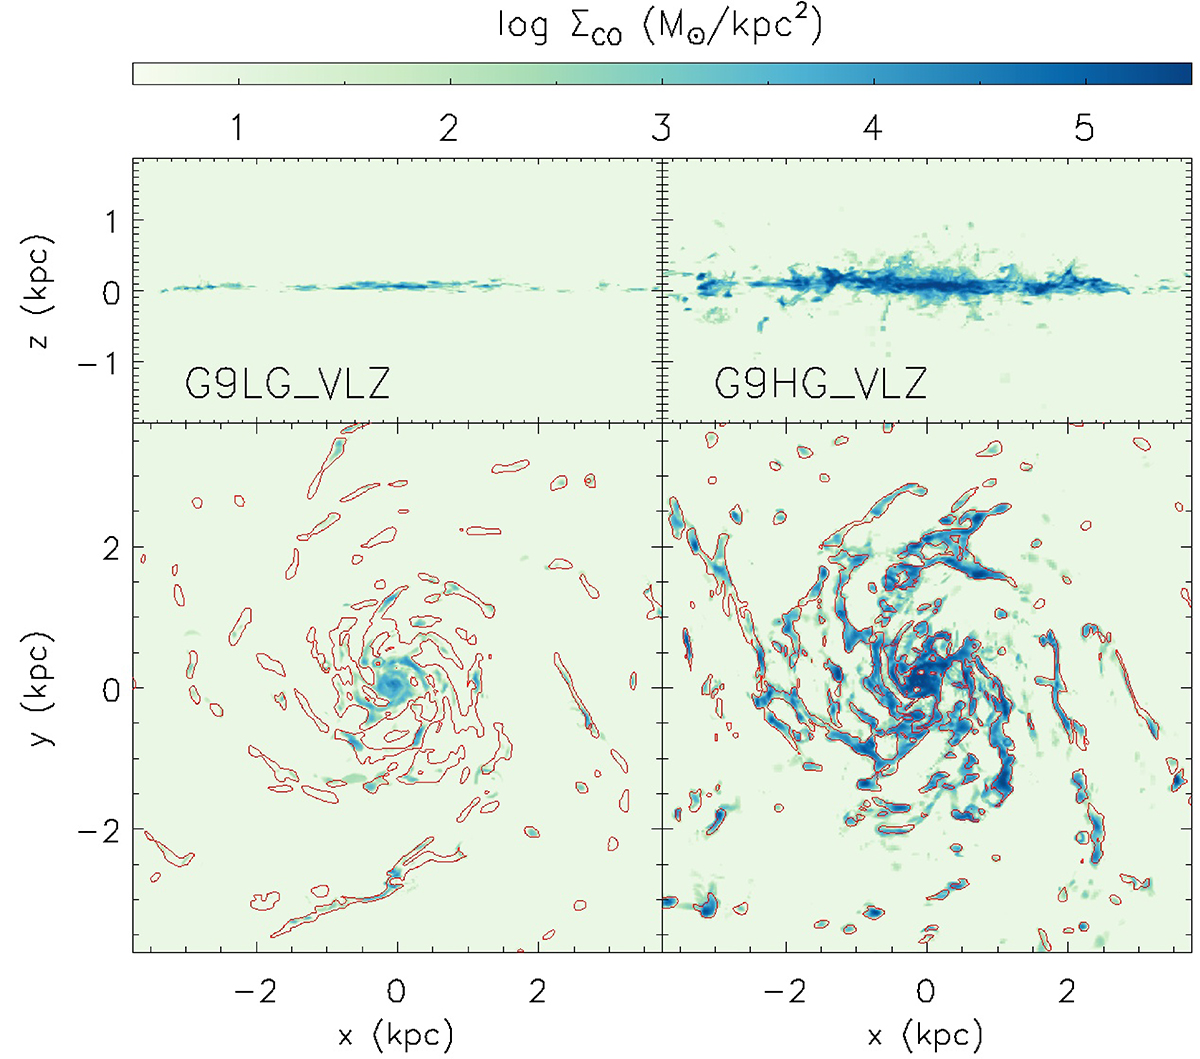
Estimated CO gas surface densities ΣCO for the gas-poor G9LG_VLZ galaxy (left panels) and the gas-rich G9HG_VLZ galaxy (right panels) at t = 400 Myr. Red are for the isocontours of projected gas density of 10 H cm−3. The gas-rich galaxy produce much more molecular gas mass than the gas-poor galaxy.
Current usage metrics show cumulative count of Article Views (full-text article views including HTML views, PDF and ePub downloads, according to the available data) and Abstracts Views on Vision4Press platform.
Data correspond to usage on the plateform after 2015. The current usage metrics is available 48-96 hours after online publication and is updated daily on week days.
Initial download of the metrics may take a while.