Fig. 19.
Download original image
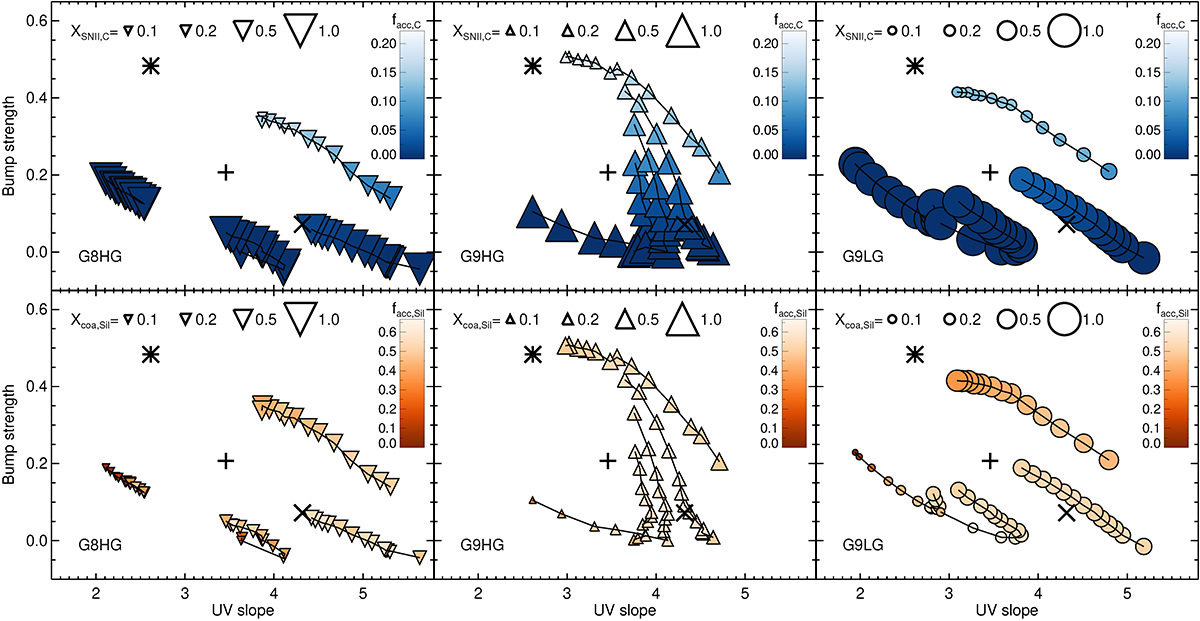
Similar to Fig. 18 where values of the extinction curve features are size-coded either by the SN ejecta XSNII, C growth strength for the case of carbonaceous grains, or by the coagulation growth strength Xcoa, Sil for the case of silicate grains, and are color-coded by the accretion fractions facc, C in blue or facc, Sil in red (see text for details). Values are shown every 25 Myr from 100 Myr to 400 Myr. Extinction curves features for different galaxy type (G8HG, G9HG, G9LG) are shown in different panels (respectively left, middle and right), and each panel contains simulations with different initial metallicities Zg, 0, from low to high initial metallicity moving from the bottom left of each panel to the top/top-right of the panel in anti-clock wise manner.
Current usage metrics show cumulative count of Article Views (full-text article views including HTML views, PDF and ePub downloads, according to the available data) and Abstracts Views on Vision4Press platform.
Data correspond to usage on the plateform after 2015. The current usage metrics is available 48-96 hours after online publication and is updated daily on week days.
Initial download of the metrics may take a while.