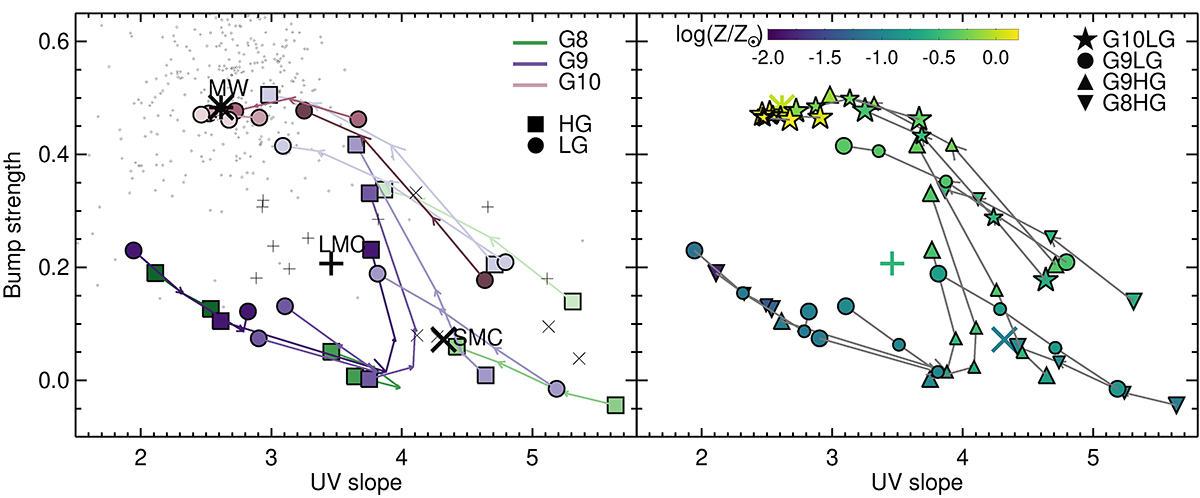
Fig. 18.
Download original image
Bump strength versus UV-to-optical slope for the different simulations. Arrows give the direction of time sampled at 100, 200, 300 and 400 Myr. The big black points are the average values of the observed MW, LMC and SMC from Pei (1992) and the smaller grey points are values for sampled sight-lines from Fitzpatrick & Massa (2007) for MW, and from Gordon et al. (2003) for SMC and LMC. The left panel is coded by simulation mass (by their color as indicated in the panel), gas fraction (by their symbol as indicated in the panel), and initial metallicity (by their color shade, from dark to light for increasing initial metallicity Zg, 0, which corresponding metallicity can be seen in Figs. 16 or 17), while the right panel is color-coded by the gas metallicity at that given time. Milky Way-like galaxies (G10LG) are naturally attracted to extinction curve features that closely resemble that of the Milky Way, with the closest they get to the true metallicity of the Milky Way the closer they are to the extinction properties of the Milky Way. Lower mass galaxies (G8 and G9) explore a much larger span of the extinction curve features’ space, and can be attributed to their lower metallicity that correlates with the features of the extinction curves.
Current usage metrics show cumulative count of Article Views (full-text article views including HTML views, PDF and ePub downloads, according to the available data) and Abstracts Views on Vision4Press platform.
Data correspond to usage on the plateform after 2015. The current usage metrics is available 48-96 hours after online publication and is updated daily on week days.
Initial download of the metrics may take a while.