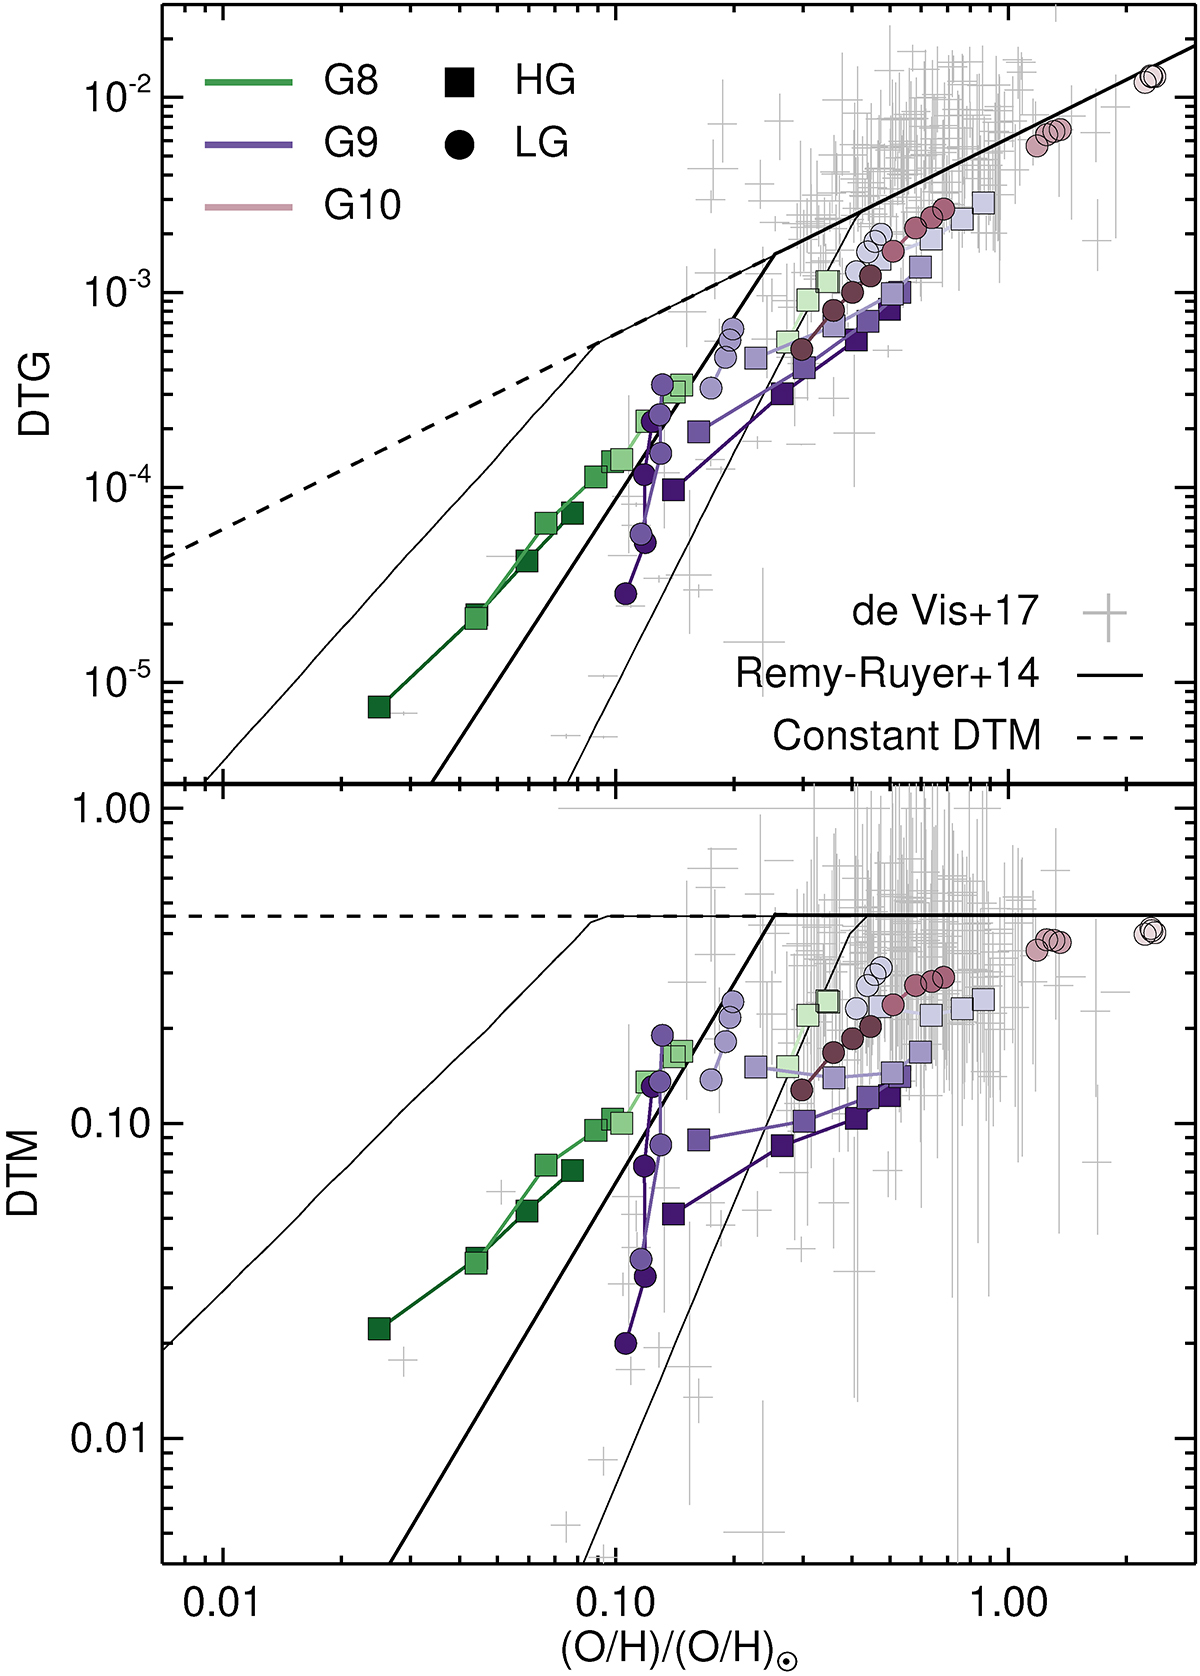
Fig. 16.
Download original image
Dust-to-gas ratio (DTG, top panel) and dust-to-metal (DTM, bottom panel) as a function of the gas phase metallicity for different simulated galaxies (varying galaxy mass and initial gas metallicity) using the fiducial model for dust evolution. Each symbol with connected lines represent a simulation at different times (100, 200, 300 and 400 Myr with increasing metallicities). Squares are for galaxies with high gas (HG) fractions, and circles for galaxies with low gas (LG) fractions. The dashed black line is the linear relation DTG ∝ [O/H], and the solid black lines are the broken power-law from observations of Rémy-Ruyer et al. (2014) for the mean (black thick solid) and the first and third quartiles (thin solid lines). The grey crosses are the observational data from De Vis et al. (2017) with error bars.
Current usage metrics show cumulative count of Article Views (full-text article views including HTML views, PDF and ePub downloads, according to the available data) and Abstracts Views on Vision4Press platform.
Data correspond to usage on the plateform after 2015. The current usage metrics is available 48-96 hours after online publication and is updated daily on week days.
Initial download of the metrics may take a while.