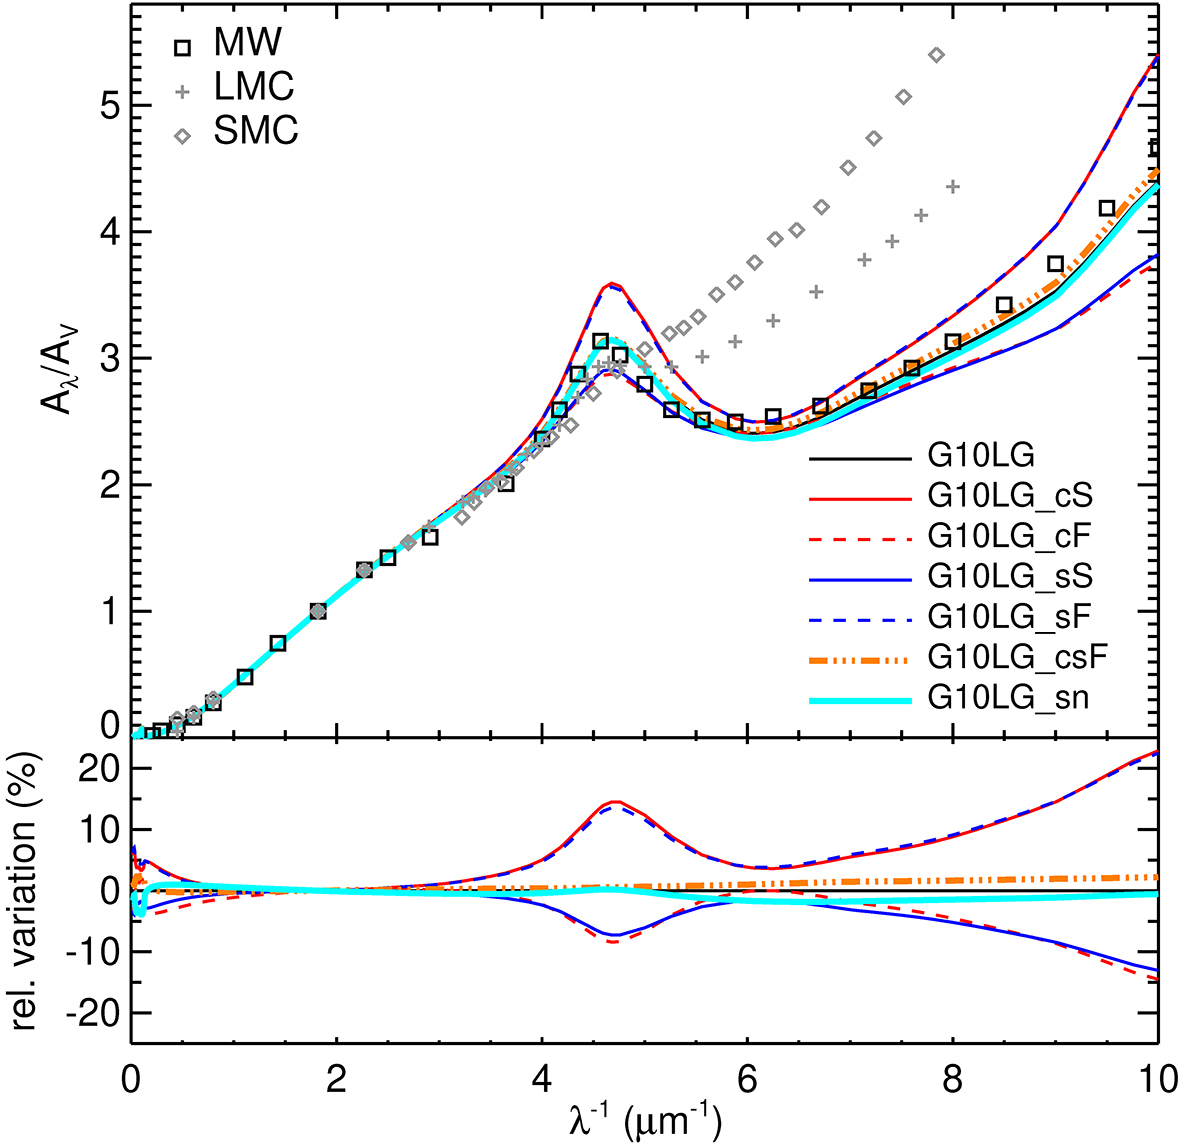
Fig. 13.
Download original image
Comparison of extinction curves in the G10LG galaxy at time t = 400 Myr for variations in coagulation (red), shattering rates (blue), and in SN dust destruction efficiency for small grains (cyan). An increase (decrease) in the corresponding rate is depicted by a dashed (respectively solid) line. The triple-dot-dashed orange line stands for an increased in both the shattering and the coagulation rates. Top panel shows the extinction curves and the bottom panel shows the relative variation of the extinction curve with respect to the fiducial simulation.
Current usage metrics show cumulative count of Article Views (full-text article views including HTML views, PDF and ePub downloads, according to the available data) and Abstracts Views on Vision4Press platform.
Data correspond to usage on the plateform after 2015. The current usage metrics is available 48-96 hours after online publication and is updated daily on week days.
Initial download of the metrics may take a while.