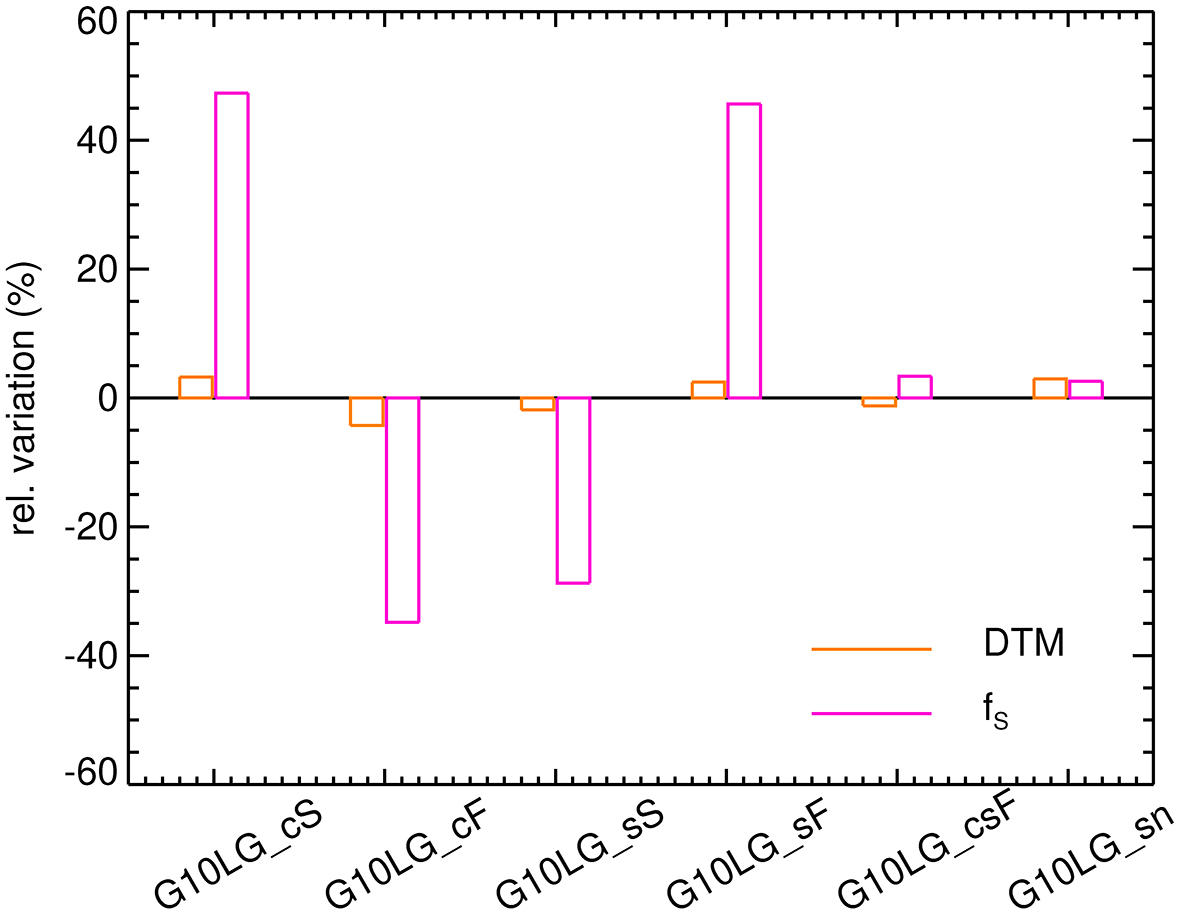
Fig. 12.
Download original image
Relative variations of the DTM (orange) and of the fraction of small grains fs (magenta) for the given run as labelled on the x-axis with respect to the G10LG simulation, decreasing or increasing the coagulation rate (resp. G10LG_cS and G10LG_cF), decreasing or increasing the shattering rate (resp. G10LG_sS and G10LG_sF), increasing both the coagulation and the shattering rates (G10LG_csF), and reducing the SN dust destruction rates (G10LG_sn). Quantities are averaged from 300 to 400 Myr. Variations of the rates of these processes have little impact on the DTM, however, variations of coagulation and shattering rates can significantly affect the fraction of small grains. Relative variations of the DTM (orange) and of the fraction of small grains fs (magenta) for the given run as labelled on the x-axis with respect to the G10LG simulation, decreasing or increasing the coagulation rate (resp. G10LG_cS and G10LG_cF), decreasing or increasing the shattering rate (resp. G10LG_sS and G10LG_sF), increasing both the coagulation and the shattering rates (G10LG_csF), and reducing the SN dust destruction rates (G10LG_sn). Quantities are averaged from 300 to 400 Myr. Variations of the rates of these processes have little impact on the DTM, however, variations of coagulation and shattering rates can significantly affect the fraction of small grains.
Current usage metrics show cumulative count of Article Views (full-text article views including HTML views, PDF and ePub downloads, according to the available data) and Abstracts Views on Vision4Press platform.
Data correspond to usage on the plateform after 2015. The current usage metrics is available 48-96 hours after online publication and is updated daily on week days.
Initial download of the metrics may take a while.