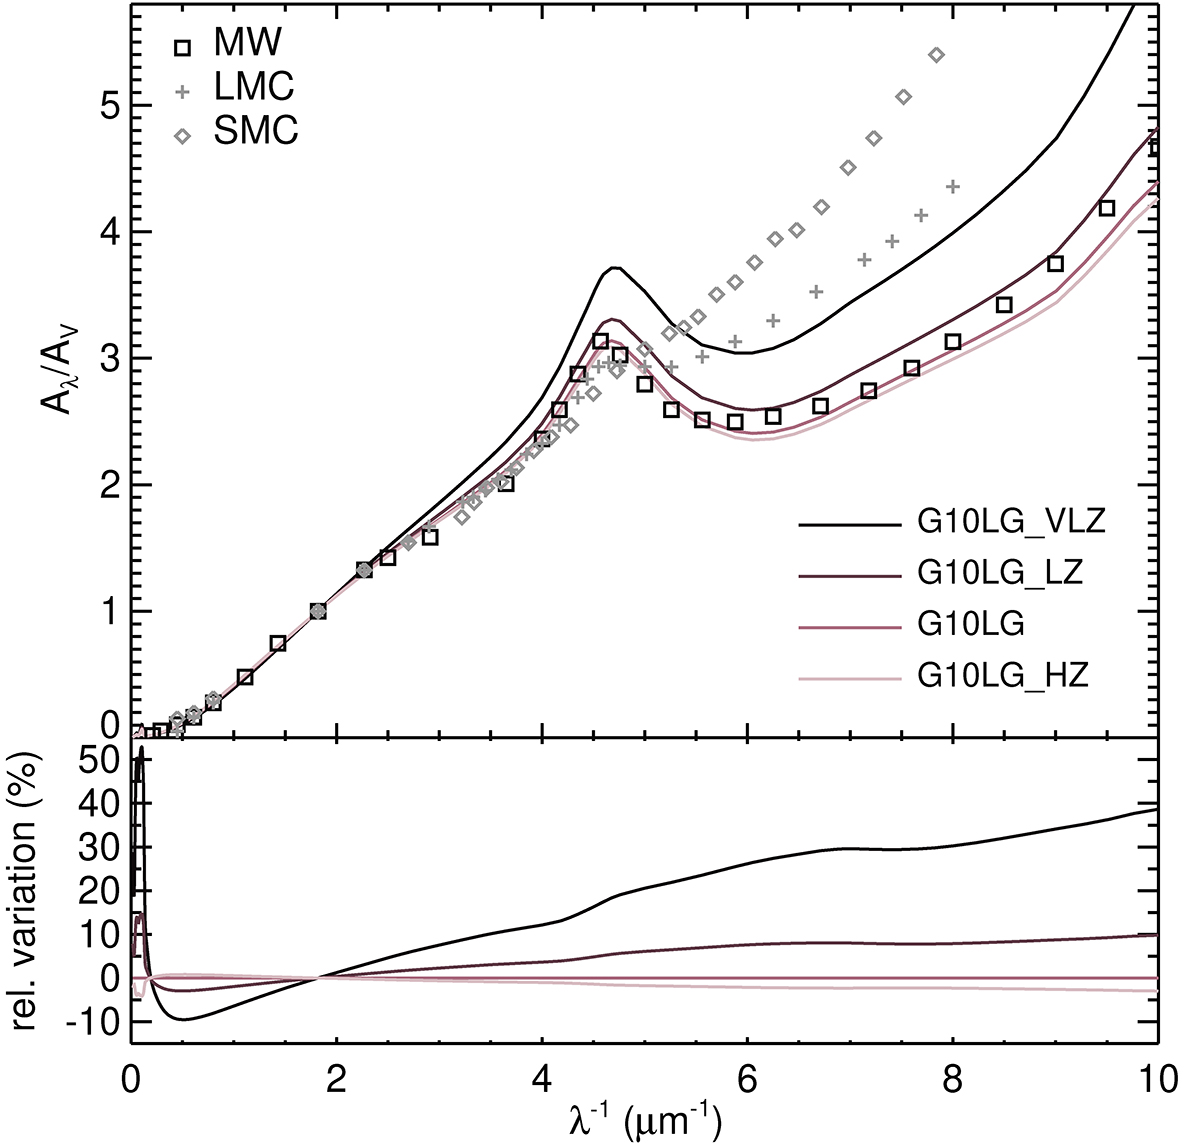
Fig. 11.
Download original image
Comparison of extinction curves in the G10LG galaxy at time t = 400 Myr for different initial metallicities (Zg, 0 = 0.1, 0.3, 1, and 2 Z⊙ for G10LG_VLZ, G10LG_LZ, G10LG, and G10LG_HZ respectively). The top panel shows the extinction curves and the bottom panel shows the relative variation of the extinction curve with respect to the fiducial simulation G10LG. Galaxies with lower metallicities produce steeper UV-to-optical slopes due lower accretion efficiencies in the dense gas where coagulation proceeds, hence, the fraction of small grains is larger.
Current usage metrics show cumulative count of Article Views (full-text article views including HTML views, PDF and ePub downloads, according to the available data) and Abstracts Views on Vision4Press platform.
Data correspond to usage on the plateform after 2015. The current usage metrics is available 48-96 hours after online publication and is updated daily on week days.
Initial download of the metrics may take a while.