Fig. 9
Download original image
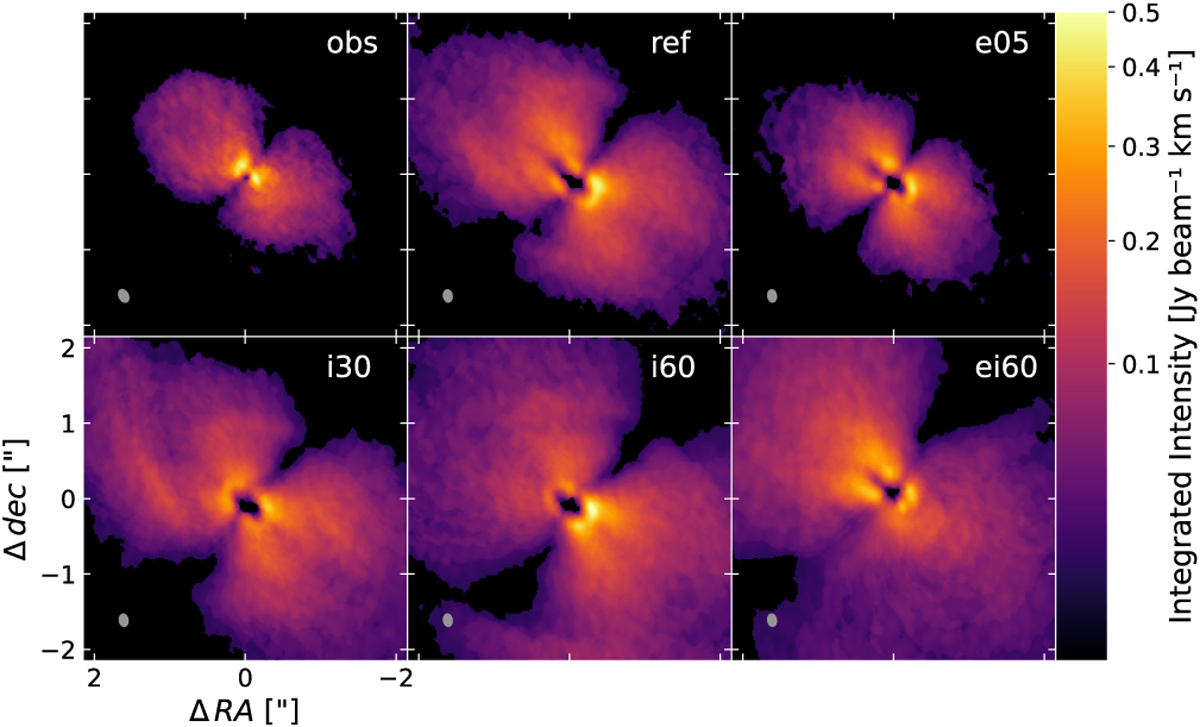
12CO (2–1) integrated intensity map of the observational data (top left) compared to the synthetic maps built from the simulations reƒ (top middle), e05 (top right), i30 (bottom left), i60 (bottom middle), and ei60 (bottom right). The discs were rotated back in the observed disc plane to allow for a proper comparison to the observations. The beam sizes are plotted in the bottom left corners.
Current usage metrics show cumulative count of Article Views (full-text article views including HTML views, PDF and ePub downloads, according to the available data) and Abstracts Views on Vision4Press platform.
Data correspond to usage on the plateform after 2015. The current usage metrics is available 48-96 hours after online publication and is updated daily on week days.
Initial download of the metrics may take a while.