Fig. 8
Download original image
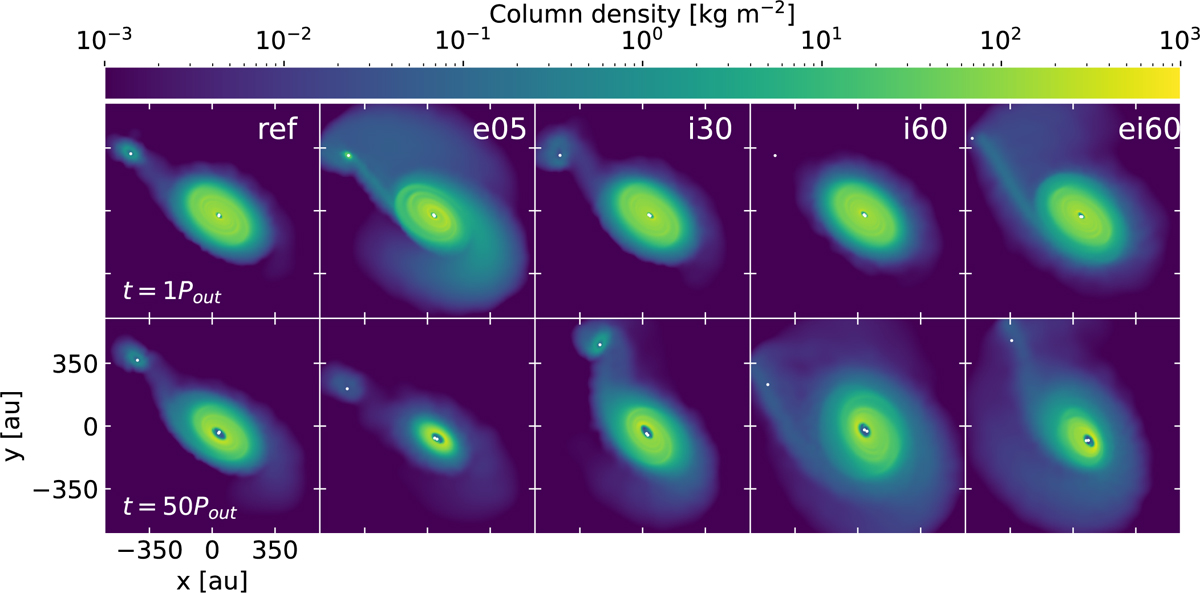
Rendered plots of the density spatial distribution integrated along the line of sight of the different simulated setups. The reƒ, e05, i30, i60, and ei60 setups are shown from left to right. The top row shows the system after one orbit of the outer companion. The bottom row displays the state of the system after approximately 50 orbits of the outer companion, corresponding to 0.2 Myr and 28 400 orbits of the inner binary. The white dots indicate the sink particles representing the stars.
Current usage metrics show cumulative count of Article Views (full-text article views including HTML views, PDF and ePub downloads, according to the available data) and Abstracts Views on Vision4Press platform.
Data correspond to usage on the plateform after 2015. The current usage metrics is available 48-96 hours after online publication and is updated daily on week days.
Initial download of the metrics may take a while.