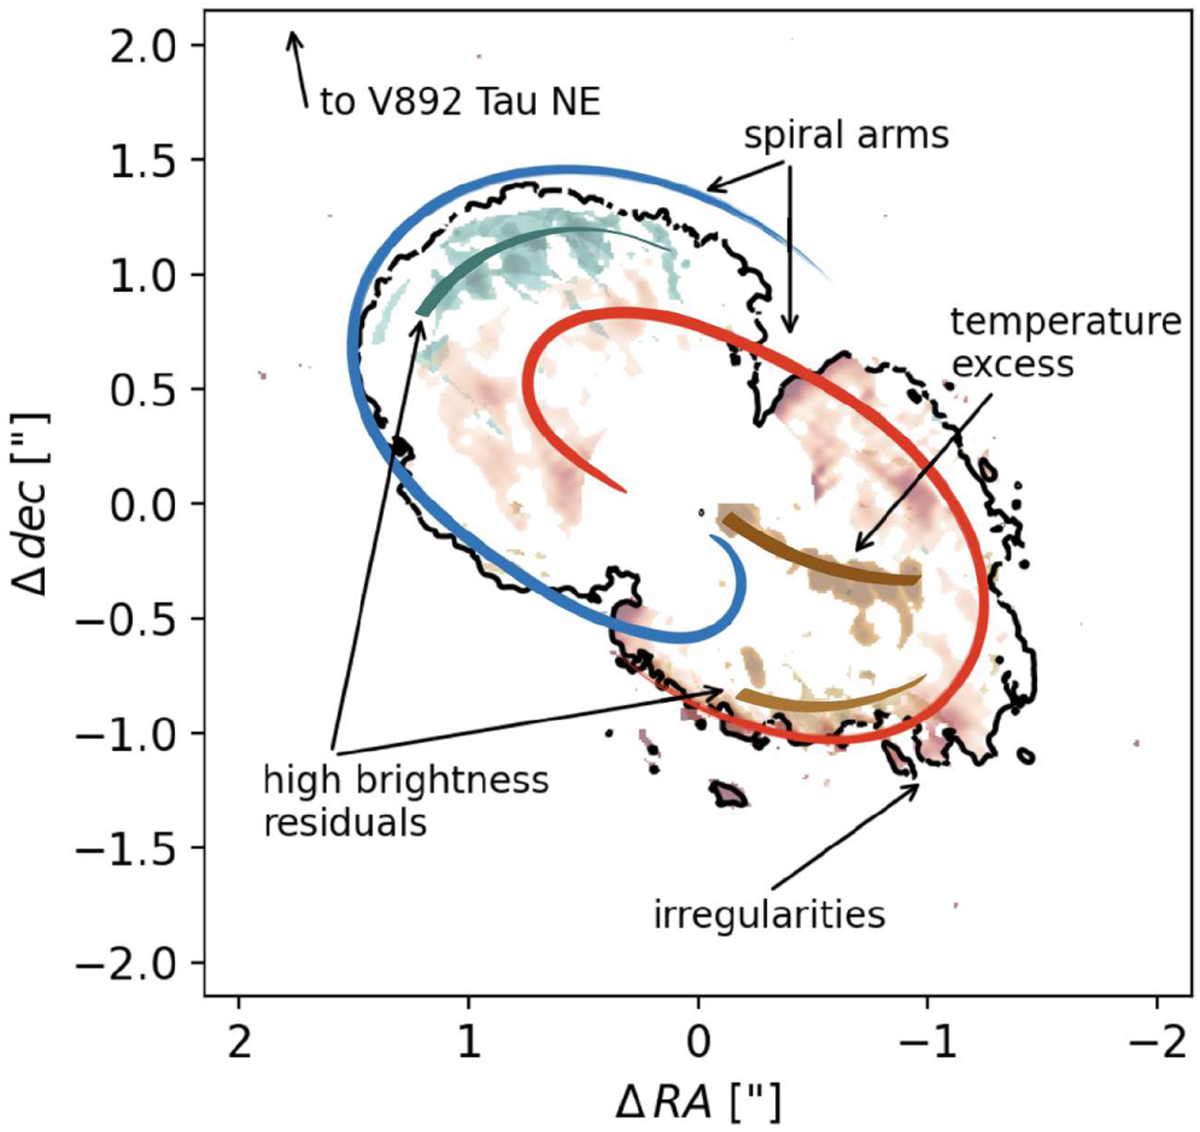
Fig. 7
Download original image
Sketch of the features identified in the CBD of V892 Tau from the residual maps shown in Fig. 6. The black line corresponds to the 3σ contour of the disc emission. The indicated high brightness residuals come from the moment 0 residuals. The spiral arms are identified on the velocity residual map, from which only the red part is plotted and the centre masked for clarity reasons. The temperature asymmetry coming from the peak temperature residual map is overlaid in dark brown. The arrow in the top left indicates the direction of V892 Tau NE.
Current usage metrics show cumulative count of Article Views (full-text article views including HTML views, PDF and ePub downloads, according to the available data) and Abstracts Views on Vision4Press platform.
Data correspond to usage on the plateform after 2015. The current usage metrics is available 48-96 hours after online publication and is updated daily on week days.
Initial download of the metrics may take a while.