Fig. 6
Download original image
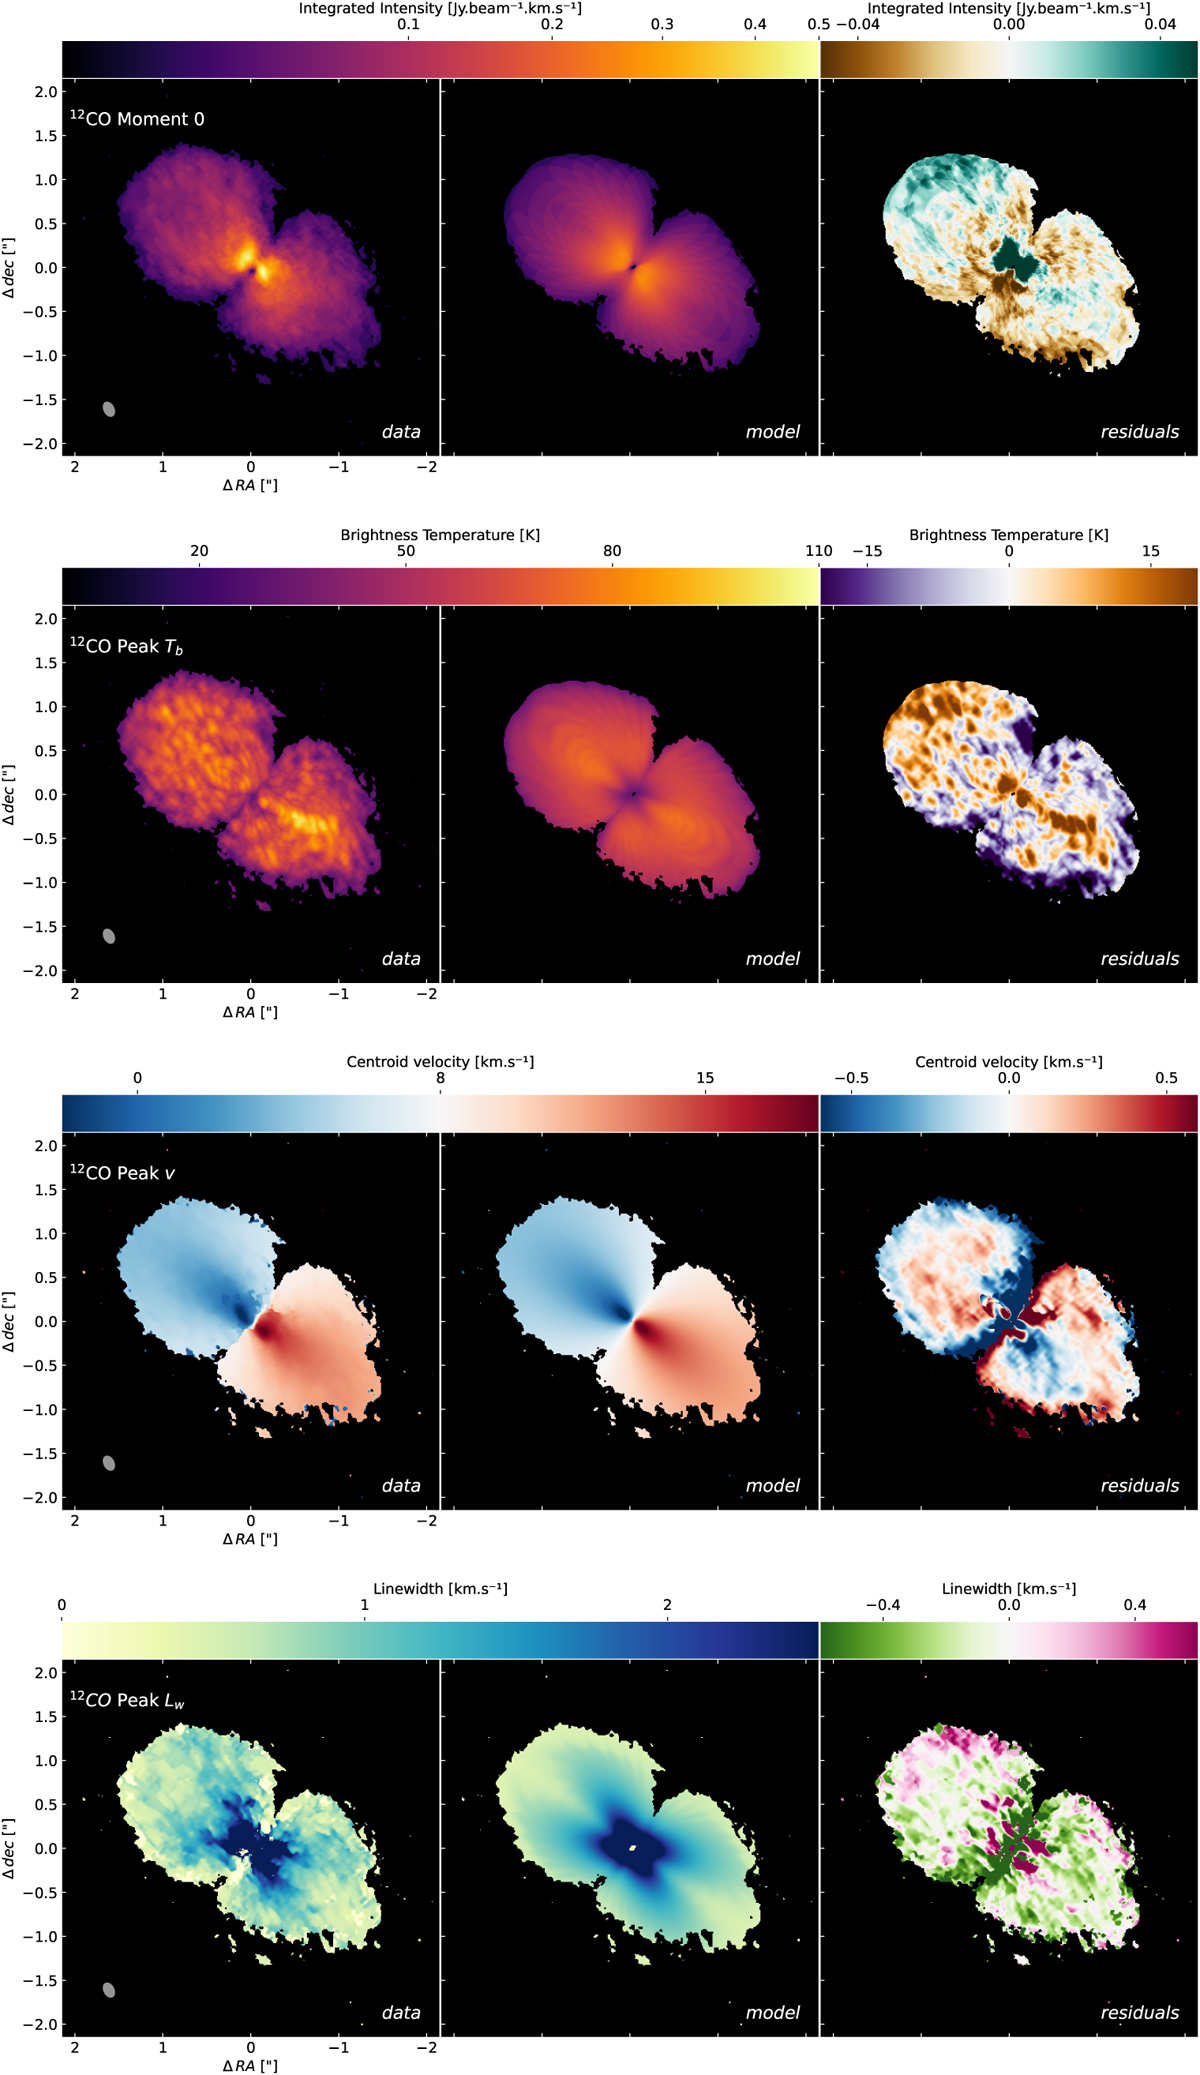
12CO (2–1) moment maps of V892 Tau. The integrated intensity, the peak temperature, the peak velocity, and the line width correspond to the first, second, third, and last rows, respectively. The first column shows moment maps computed from the data emission channels, the second column from the model and the last column shows the residuals in the detected disc area computed from the two previous maps. A mask defined by the 3σ contour of the data has been applied to the model before comparison with the data.
Current usage metrics show cumulative count of Article Views (full-text article views including HTML views, PDF and ePub downloads, according to the available data) and Abstracts Views on Vision4Press platform.
Data correspond to usage on the plateform after 2015. The current usage metrics is available 48-96 hours after online publication and is updated daily on week days.
Initial download of the metrics may take a while.