Open Access
Fig. 5
Download original image
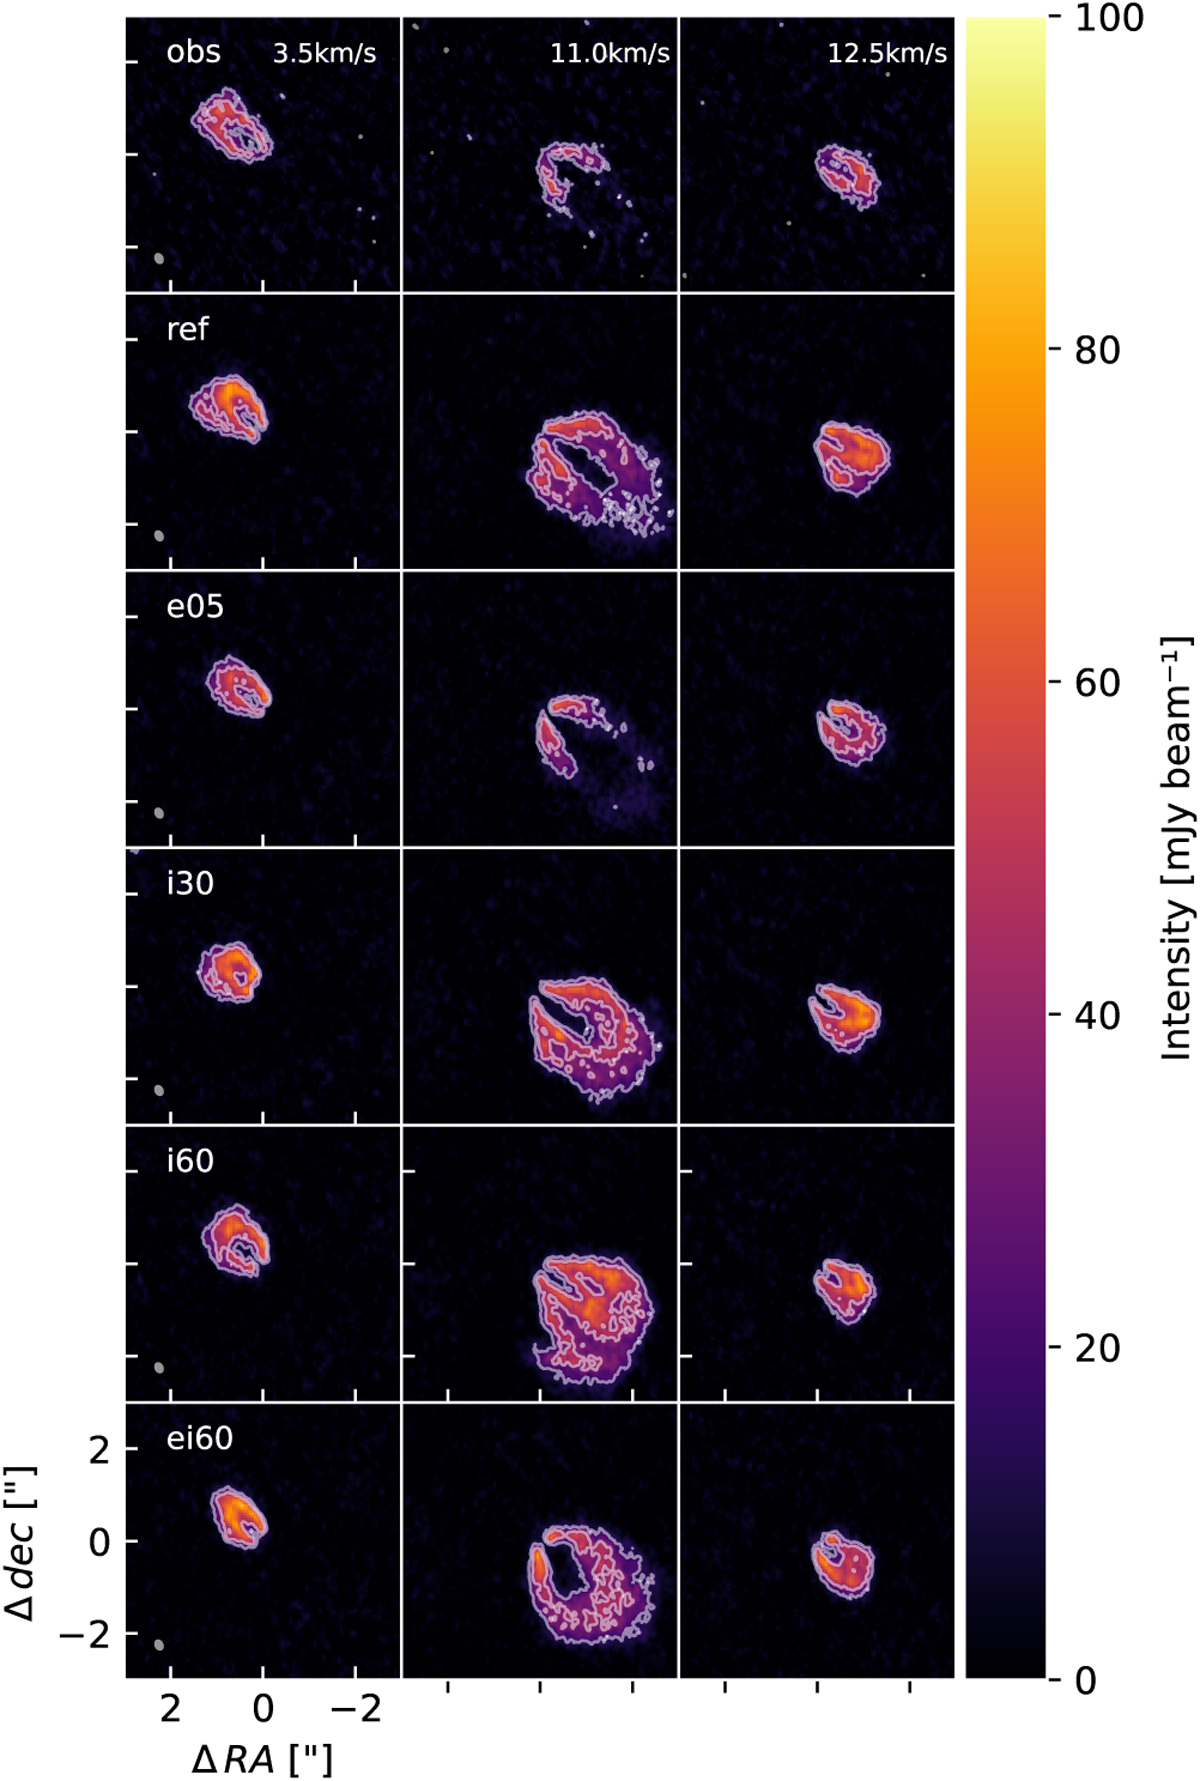
Comparison of channel maps at 3.5 km s−1 (left), 11 km s−1 (middle), and 12.5 km s−1 (right) of the observed emission (top row) and of the synthetic emission (following rows, in order: ref, e05, i30, i60, and ei60). The contours represent the [3,7]σ emission levels. The beam size is represented by the grey ellipses.
Current usage metrics show cumulative count of Article Views (full-text article views including HTML views, PDF and ePub downloads, according to the available data) and Abstracts Views on Vision4Press platform.
Data correspond to usage on the plateform after 2015. The current usage metrics is available 48-96 hours after online publication and is updated daily on week days.
Initial download of the metrics may take a while.