Fig. 2
Download original image
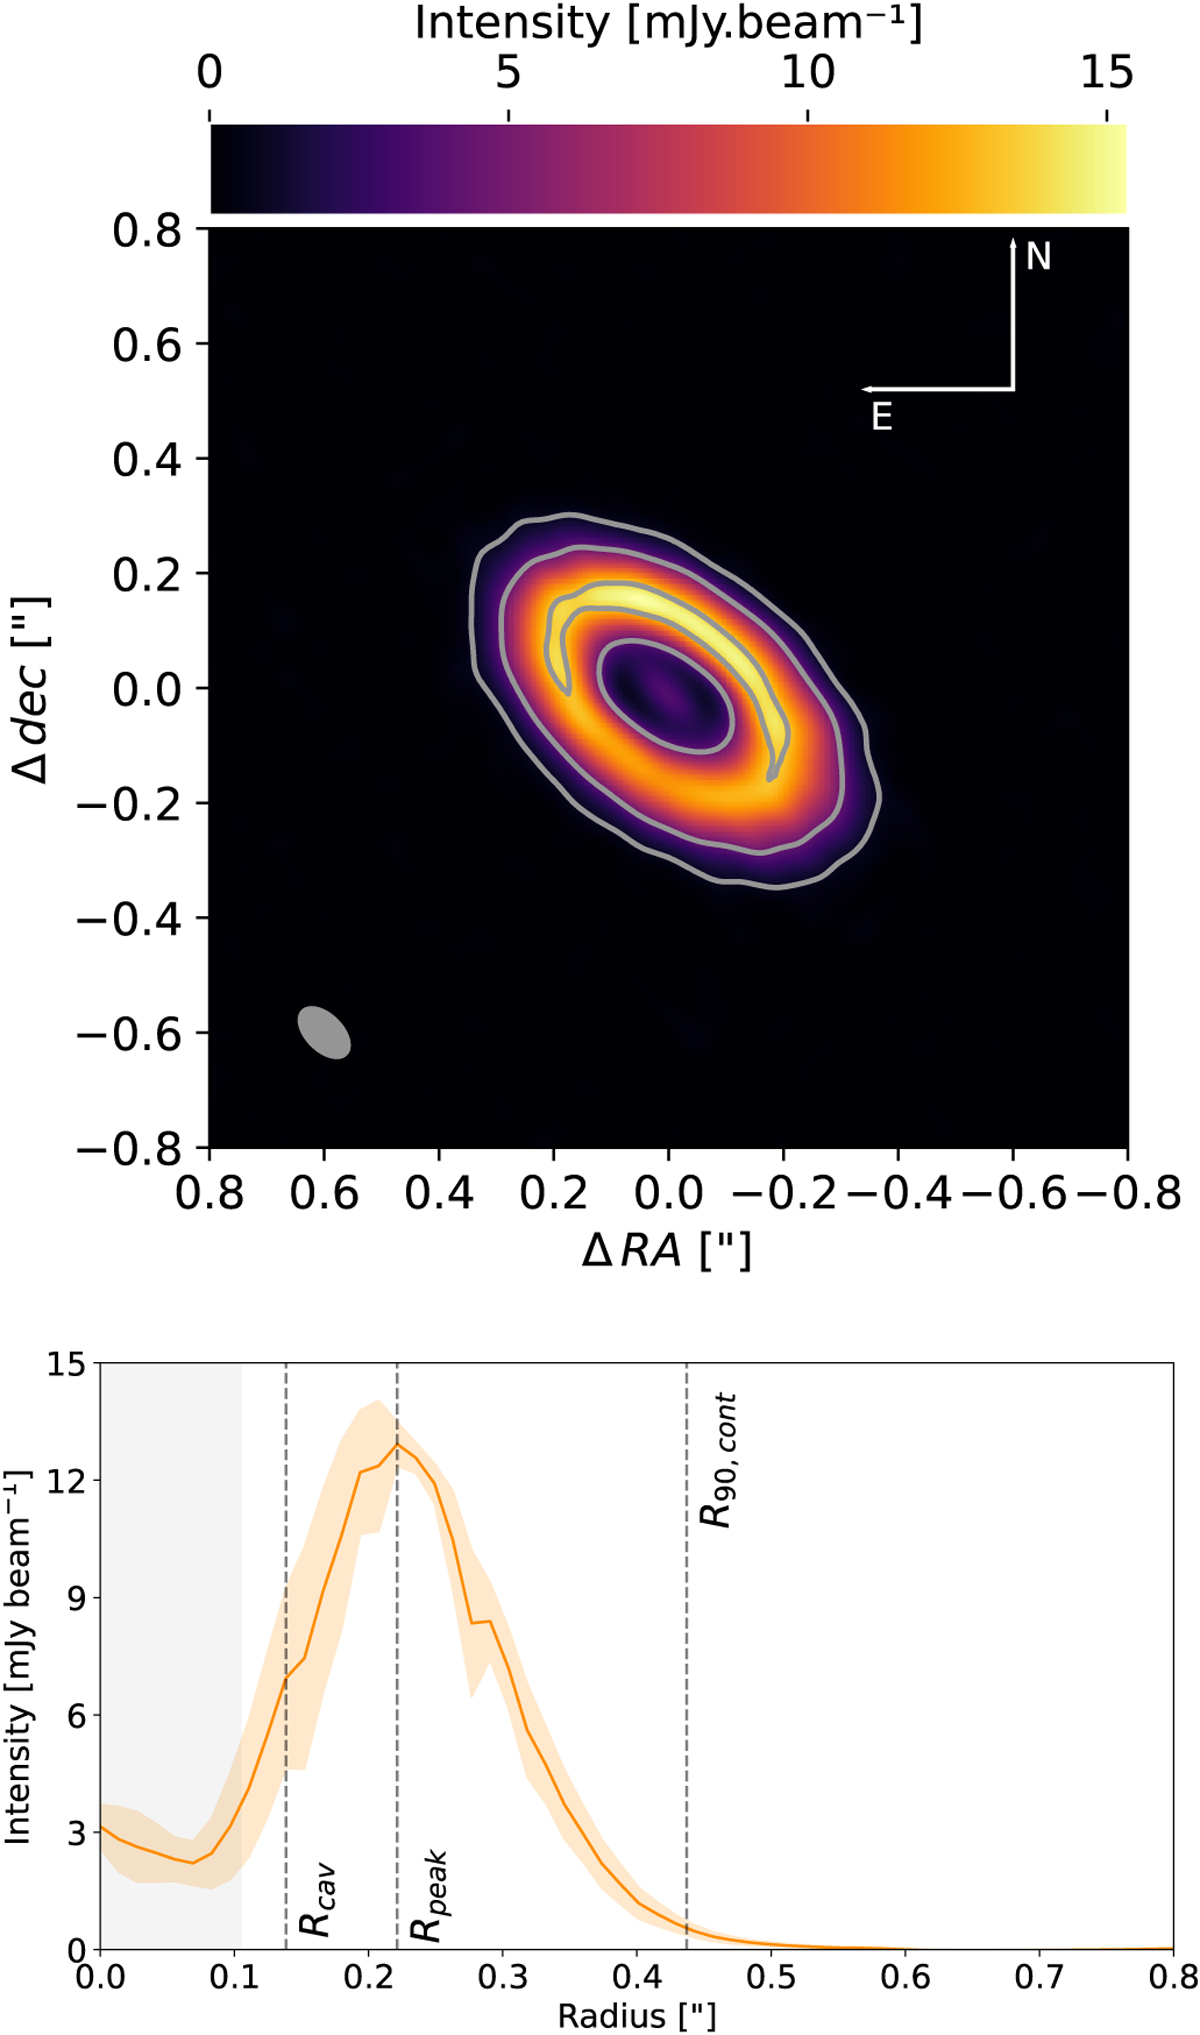
ALMA band 6 continuum emission map (top) and depro-jected azimuthally averaged intensity profile (bottom) at 224 GHz of V892 Tau. In the top image, contour levels are at 10σ, 50σ, and 150σ. In the bottom plot Rcav, Rpeak, and R90,cort correspond to the radius of the cavity, of the peak of the ring, and of the disc, respectively. The shaded orange area represents to the standard deviation of each annulus divided by the square root of the beam numbers along the annulus at each radial bin. The shaded grey area represents the major axis of the synthesised beam.
Current usage metrics show cumulative count of Article Views (full-text article views including HTML views, PDF and ePub downloads, according to the available data) and Abstracts Views on Vision4Press platform.
Data correspond to usage on the plateform after 2015. The current usage metrics is available 48-96 hours after online publication and is updated daily on week days.
Initial download of the metrics may take a while.