Open Access
Fig. B.1
Download original image
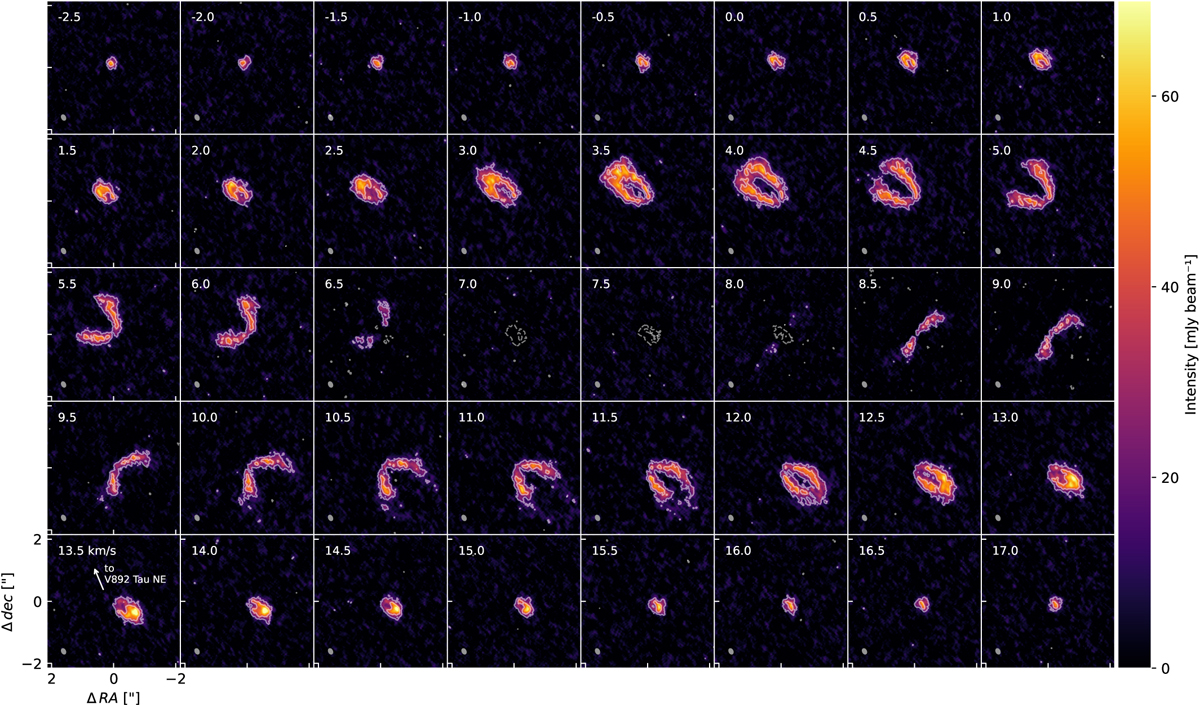
12CO channel maps of V892 Tau. The contours shows the [3, 7]σ emission levels. The dashed line represents corresponding negative emission levels. The velocity of the emission channels is indicated at the top left. The synthesised beam is plotted at the bottom left of each channel.
Current usage metrics show cumulative count of Article Views (full-text article views including HTML views, PDF and ePub downloads, according to the available data) and Abstracts Views on Vision4Press platform.
Data correspond to usage on the plateform after 2015. The current usage metrics is available 48-96 hours after online publication and is updated daily on week days.
Initial download of the metrics may take a while.