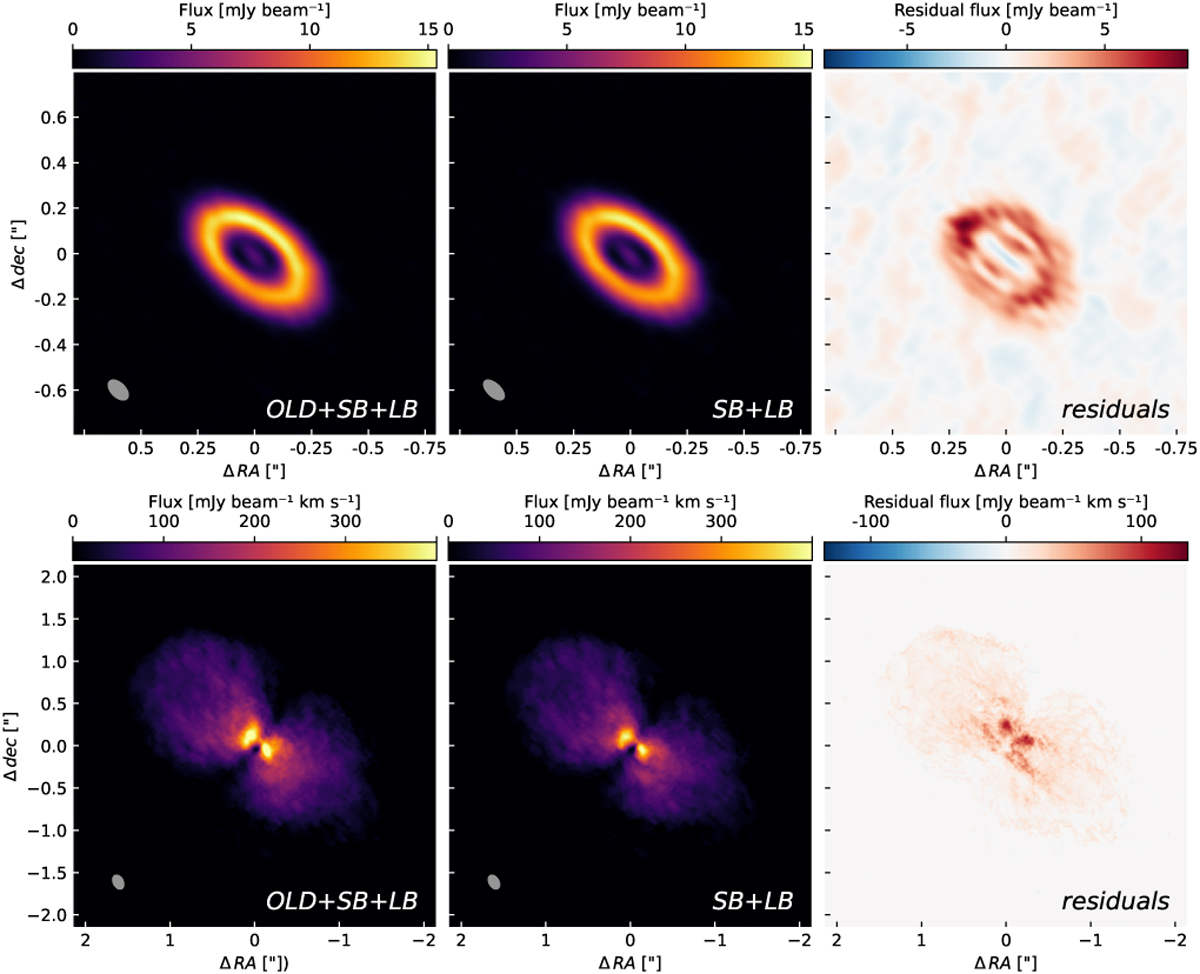
Fig. A.1
Download original image
Comparison of the ALMA band 6 continuum (top) and 12CO (2–1) moment 0 (bottom) images resulting from the different data-sets combination. The left image in each panel has been created from SB, LB and the data-set used in L21. The middle image in each panel results from the combination of SB and LB only. The images on the right are residual maps, which are uniformly positive, highlighting the benefits of the data combination.
Current usage metrics show cumulative count of Article Views (full-text article views including HTML views, PDF and ePub downloads, according to the available data) and Abstracts Views on Vision4Press platform.
Data correspond to usage on the plateform after 2015. The current usage metrics is available 48-96 hours after online publication and is updated daily on week days.
Initial download of the metrics may take a while.